August 5, 2026
Insights
How many people can reach a doctor within a 10-minute walk? It sounds simple — but in a GIS it usually means running one tool, saving a layer you don’t care about, feeding it into the next tool, and repeating all of that every time the data changes. Workflows are how you stop doing that by hand.
A GIS workflow is a single analysis pipeline that chains several spatial analysis tools together, so the output of one step flows straight into the next. You build the chain once and run the whole thing at once — no throwaway layers in between.
GOAT is more than a data management and visualization web tool, spatial analysis is one of its pillars, allowing users to analyse layers, compare them and run a full evaluation. Its tools are grouped into four fields:
• Accessibility for routing and travel related questions.
• Geoprocessing for geometry change based on how geometries interact.
• Geoanalysis for more complex spatial analysis like clustering or geocoding.
• Data management for merging or joining layers.
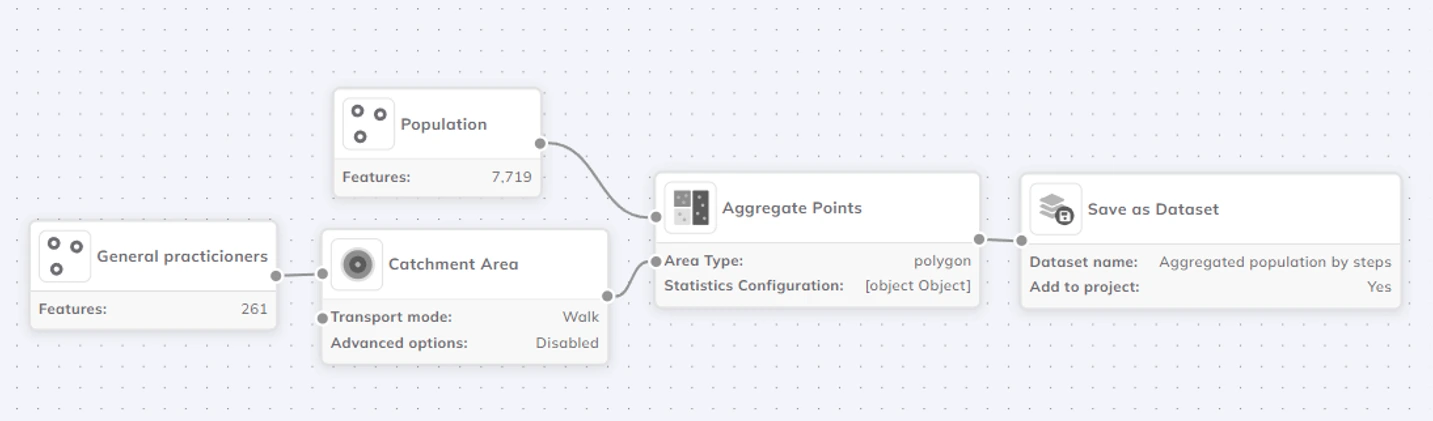
Used together, these tools provide a comprehensive result — for example, the number of people within a 10-minute walk of a general practitioner. Normally that takes two steps:
1. “Catchment area” tool with the general practitioner as starting point → generates one layer: the catchment area polygon
2. “Aggregate point” tool with the population and the catchment area result → generates one layer with an additional column: the population
The catchment polygon in the middle is a layer you never actually wanted — you’d just delete it afterwards. A workflow skips it: you build the pipeline once and get straight to the answer.

The workflow is an analyticaltool that goes beyond the single analysis tools. It allows users to bringtogether different analysis tools to form a single analysis pipeline. Workflows in GOAT also offer additional tools likeconditional analysis or custom SQL.
The real value isn’t just fewer clicks or fewer junk layers. It’s reuse — and it shows up in four ways:
For a long analysis that is repeated with updated data, the workflow is the tool to choose. Writing down all the steps you did for the analysis in the report and trying to repeat it 6 months later is not only time-consuming but also can cause errors if something was not properly written down. With a workflow you just update the data and run it again. The exact same pipeline is repeated.
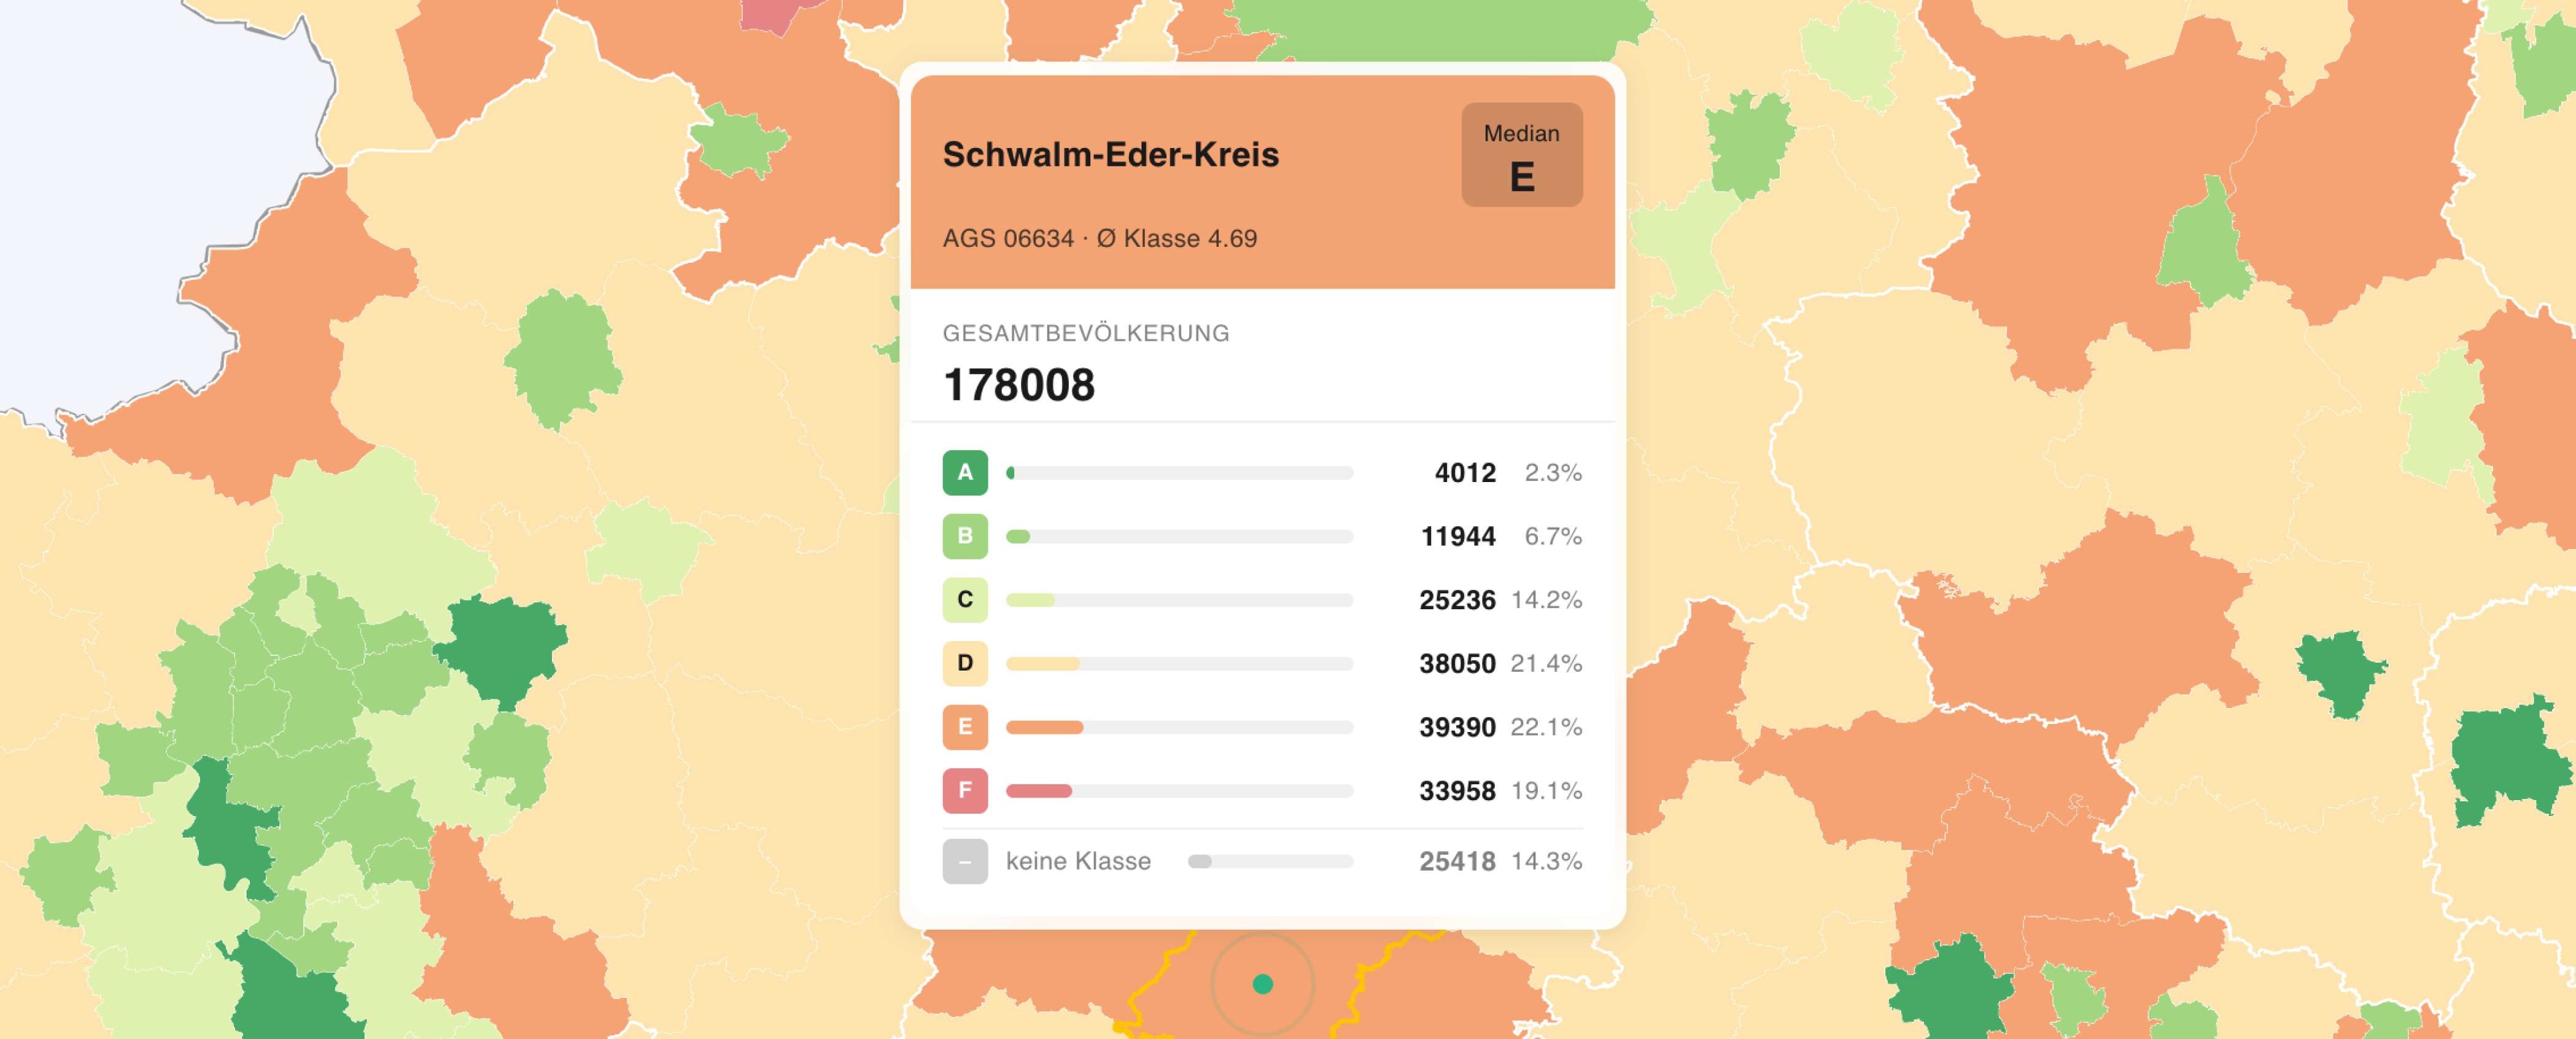
Example of use case: The public transport data (GTFS) change over the year and any quality evaluation may need to be reconducted with a new provided timetable, like the change in the ÖV-Güteklassen (public transport quality classes) between different years.
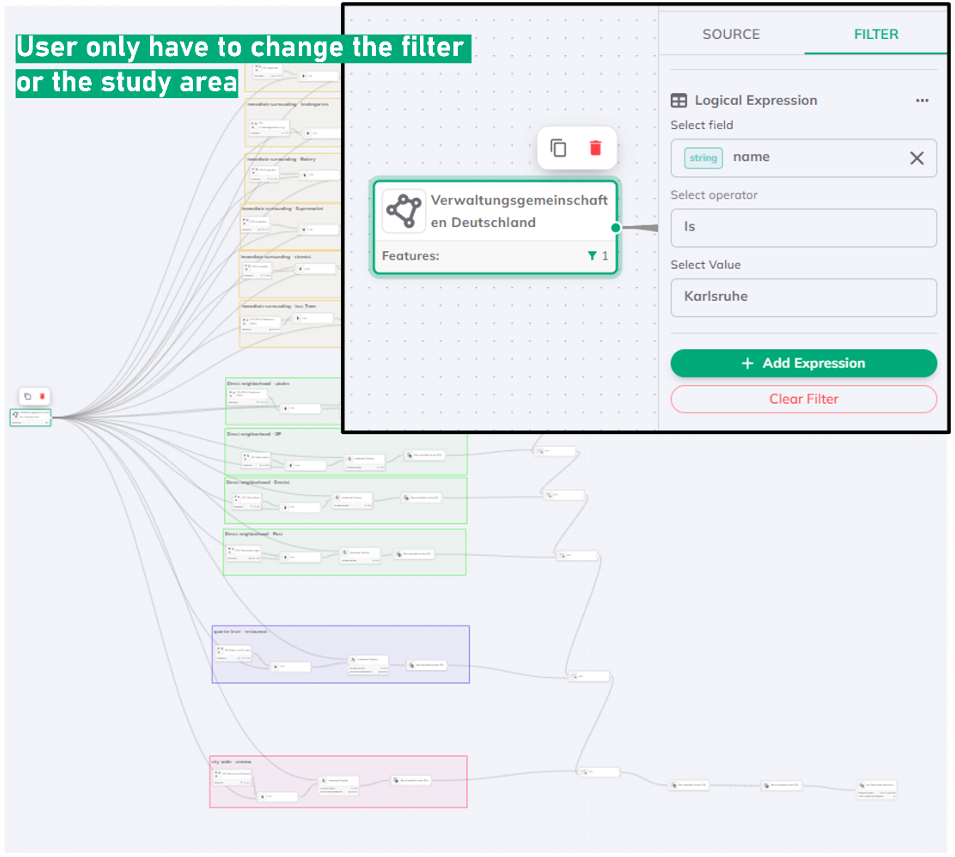
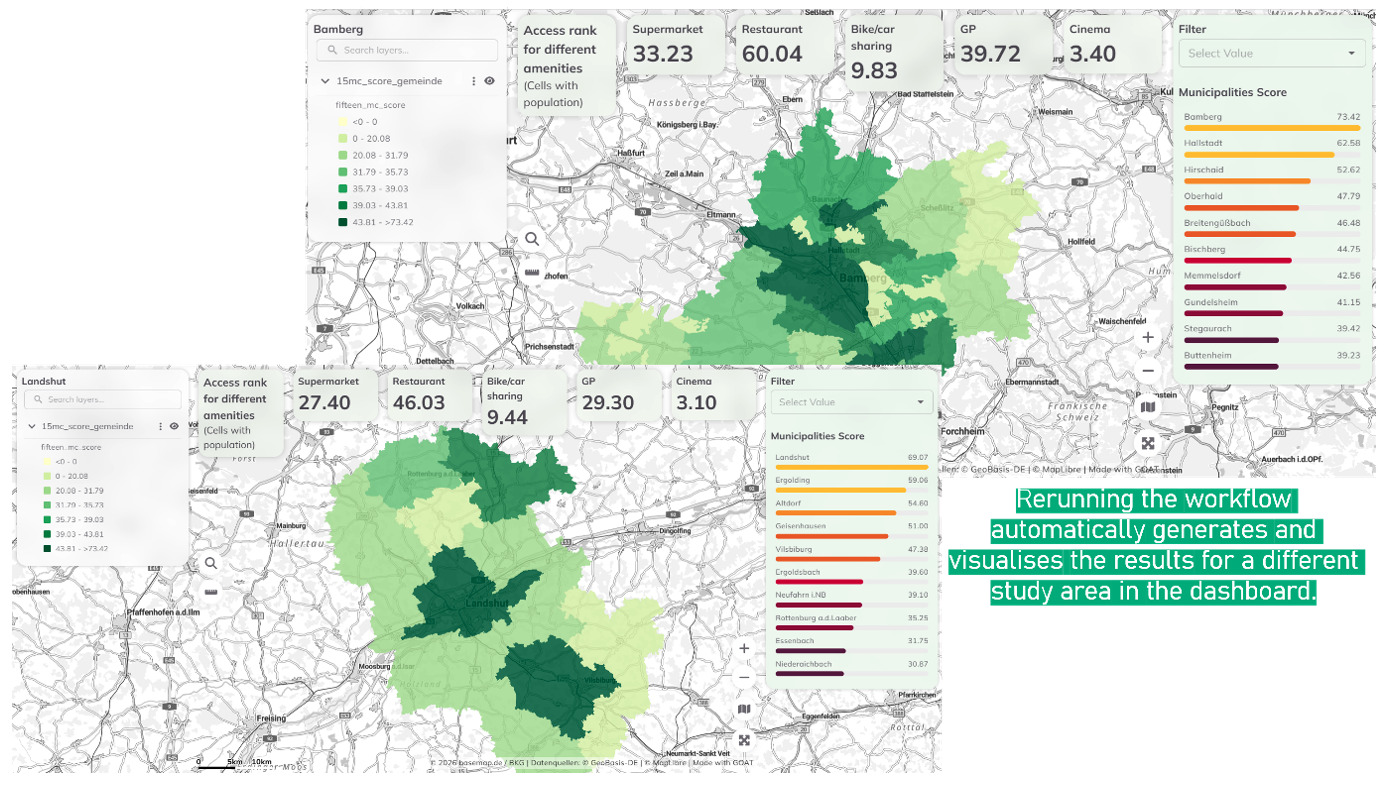
When the same analysis has to be run for several study areas, the workflow is again the tool to choose. Instead of manually redoing every step for each city, you build the pipeline once and simply filter the open data to your area of interest. The same process runs on a new location in seconds.
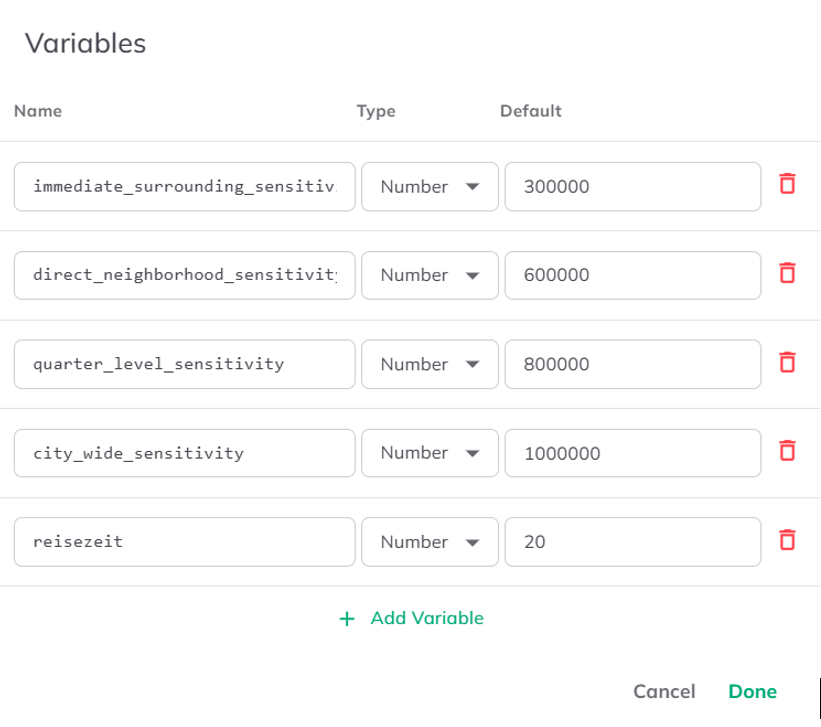
Sometimes it is not the data or the location that changes, but the settings — a threshold, a weight, a travel time. The workflow in GOAT lets you define these values as variables, so you can adjust and rerun in seconds. That makes it easy to test different configurations and check how sensitive your results are to each parameter.
Example of use case: To test a 15-, 20- or 30-min city, just change one variable in the workflow — no need to rebuild the workflow or edit each tool.
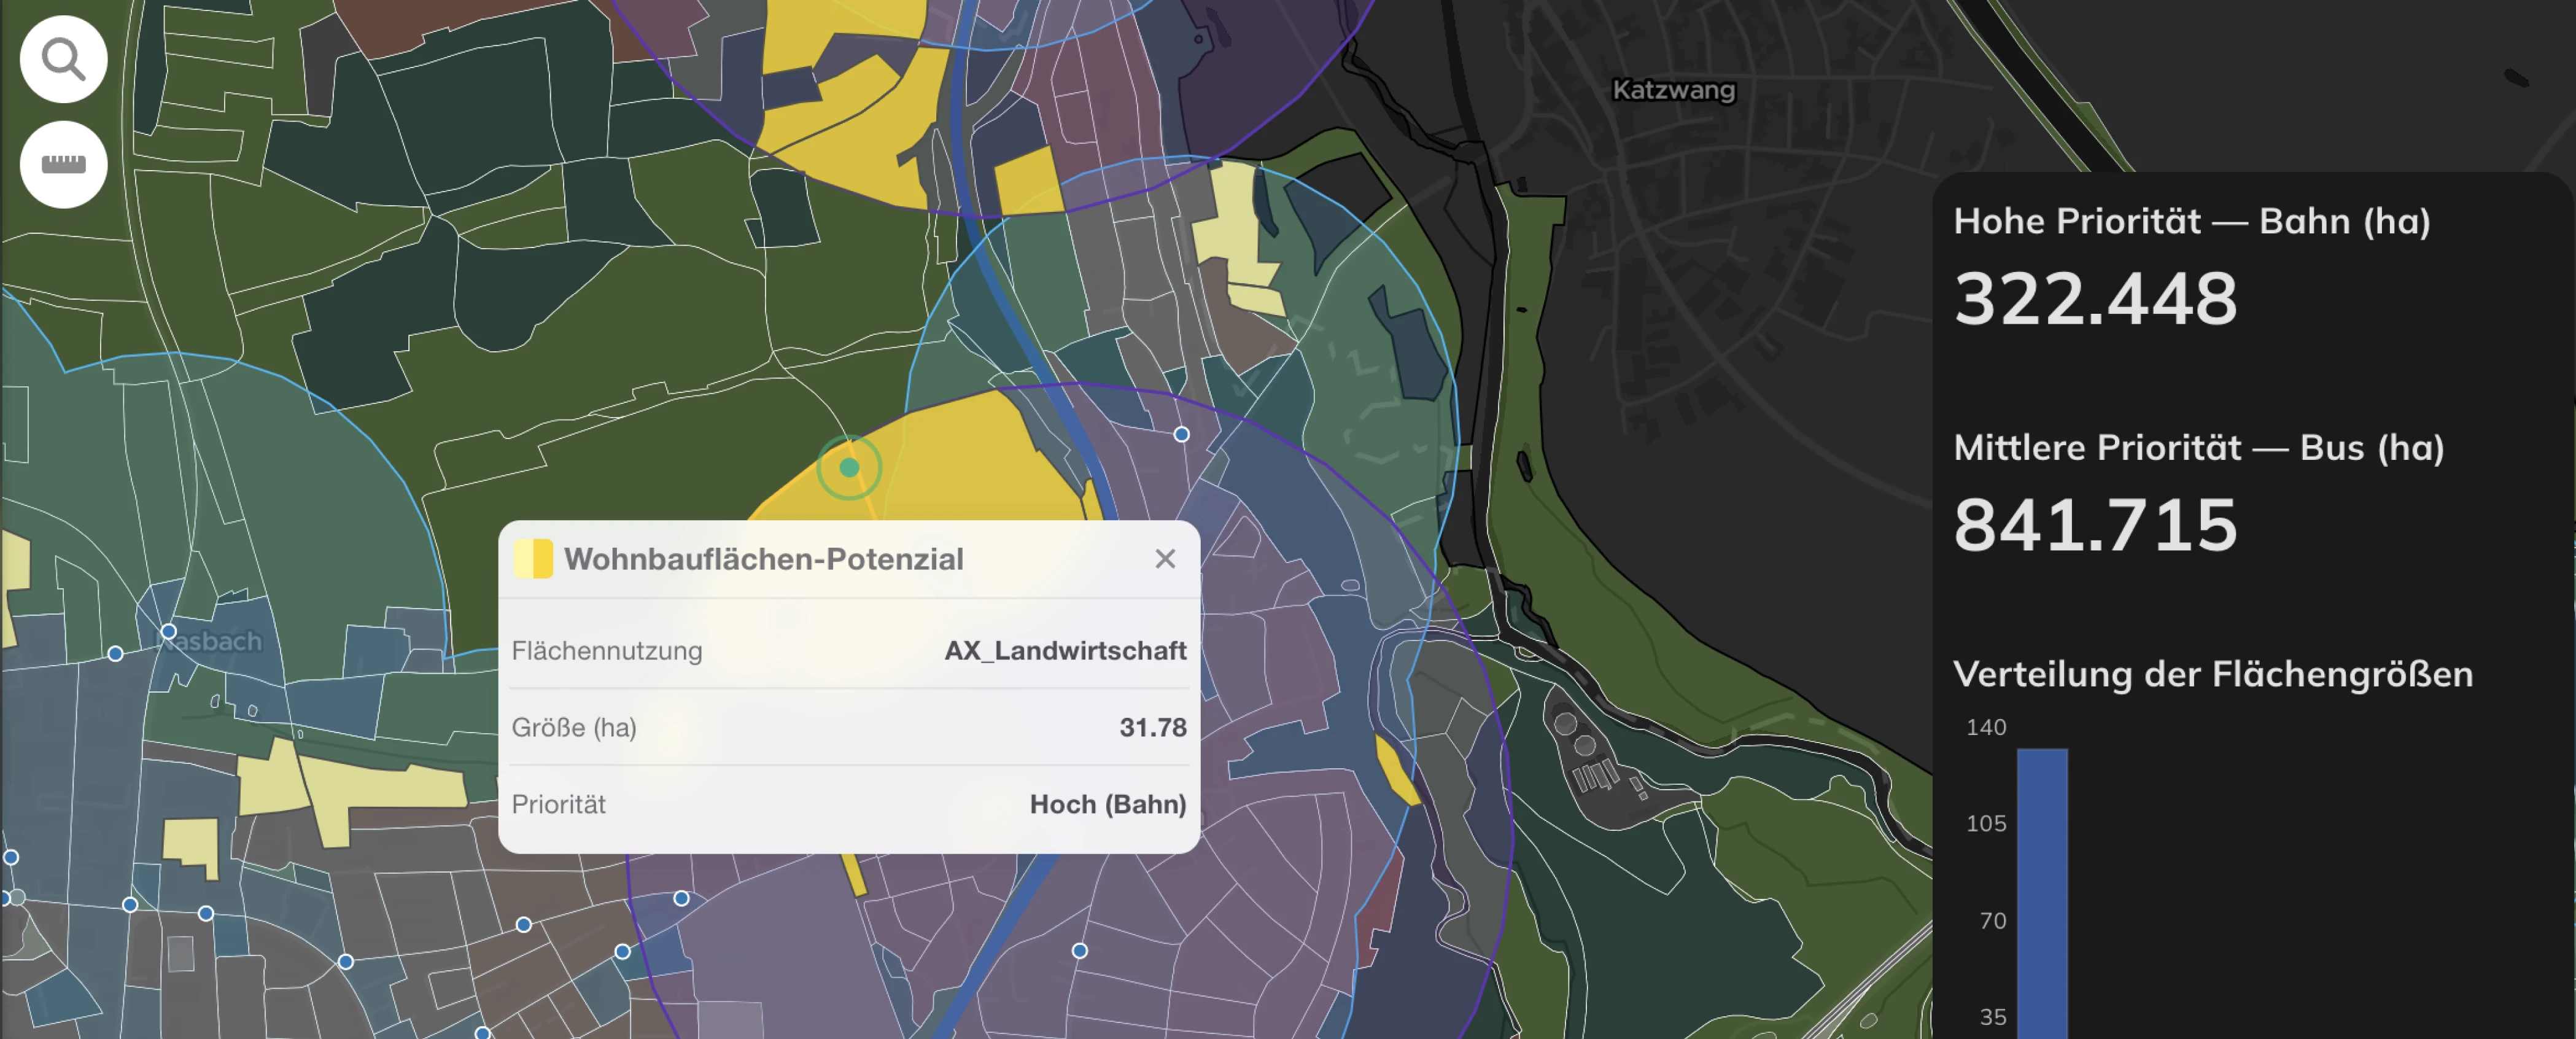
Beyond providing a reusable analysis pipeline, workflows also standarize your outputs and maps. By overwriting the result layer, a prepared dashboard or layout is automatically fed with the new data, allowing you to produce the same maps and share comparable information every time.
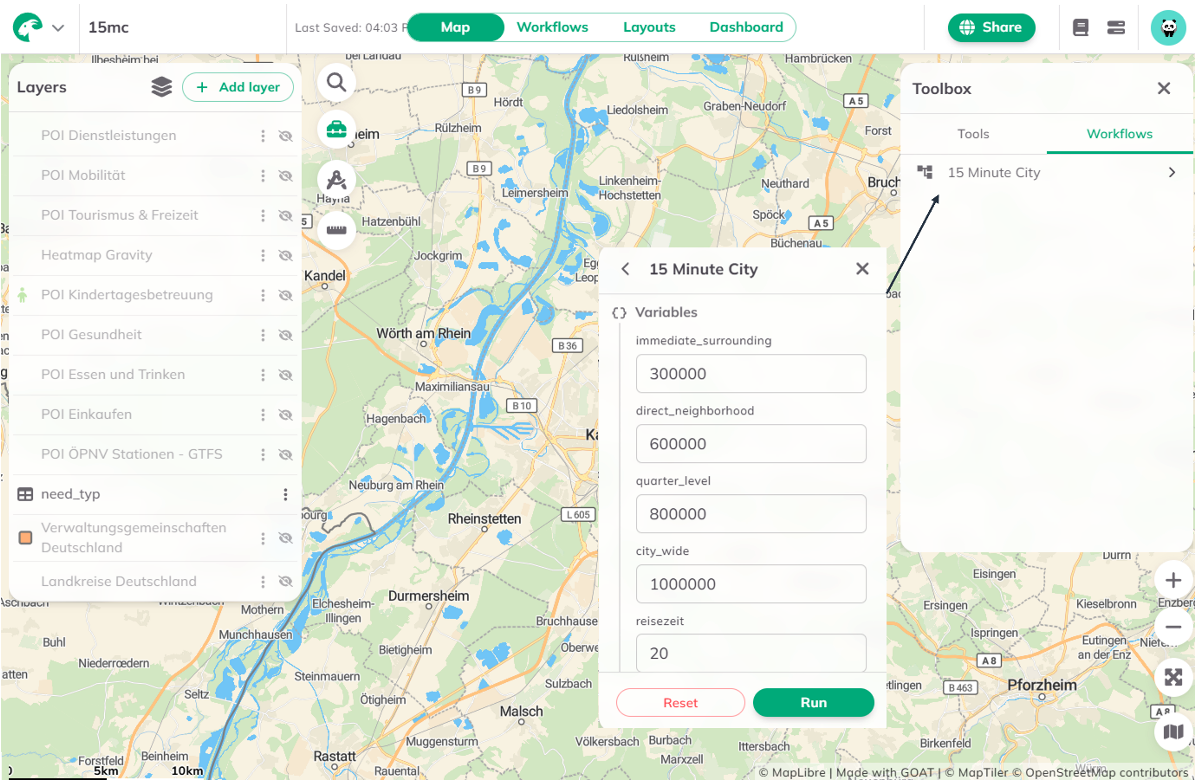
Workflows can easily get complex, sometimes involving a bit of coding with the custom SQL tool. A convenient way to work with them: one person builds the workflow, and the other users simply run it as a classical tool, directly in the GOAT Map view, just adjusting the parameters.
Nowadays, AI can be really helpful for writing custom SQL if you’re not sure how to do it yourself. With custom SQL and the help of AI you can basically do anything.
And if you have a project in mind but don’t know where to start, you can reach out to us — we can prepare a workflow for you.
The point of a workflow isn’t the workflow. It’s getting back the hours you’d spend rebuilding the same analysis — and trusting the result is identical every time you run it.
Try GOAT for free and test workflows to bring your own analysis to life every time and everywhere you want.
What is a GIS workflow?
A GIS workflow is a single pipeline that connects several spatial analysis tools so each step feeds the next — you build it once and run the whole chain in one go, instead of running each tool by hand.
When should you use a GIS workflow?
Whenever you’ll repeat an analysis — with updated data, for a new location, or with different settings — or when you want a standardised, shareable output.
What’s the difference between a single tool and a workflow?
A single tool does one operation and saves one layer. A workflow chains many tools, skips the throwaway layers in between, and adds extras like conditional logic and custom SQL.
Do you need to know how to code to build one?
No.Most steps are click-based. The custom SQL tool helps for advanced cases — and you can ask AI for help, or have Plan4Better build it for you.
Can you reuse a workflow for different cities?
Yes. Build the pipeline once, then filter the open data to a new study area and rerun — the same process runs on the new location in seconds.
Insights
.png)
Development