Climate change is reshaping how cities plan — from heat adaptation and green space provision to sustainable mobility and equitable access. GOAT supports planners, researchers, and public authorities in developing data-driven strategies for climate adaptation and sustainable urban development, from neighbourhood scale to national monitoring.
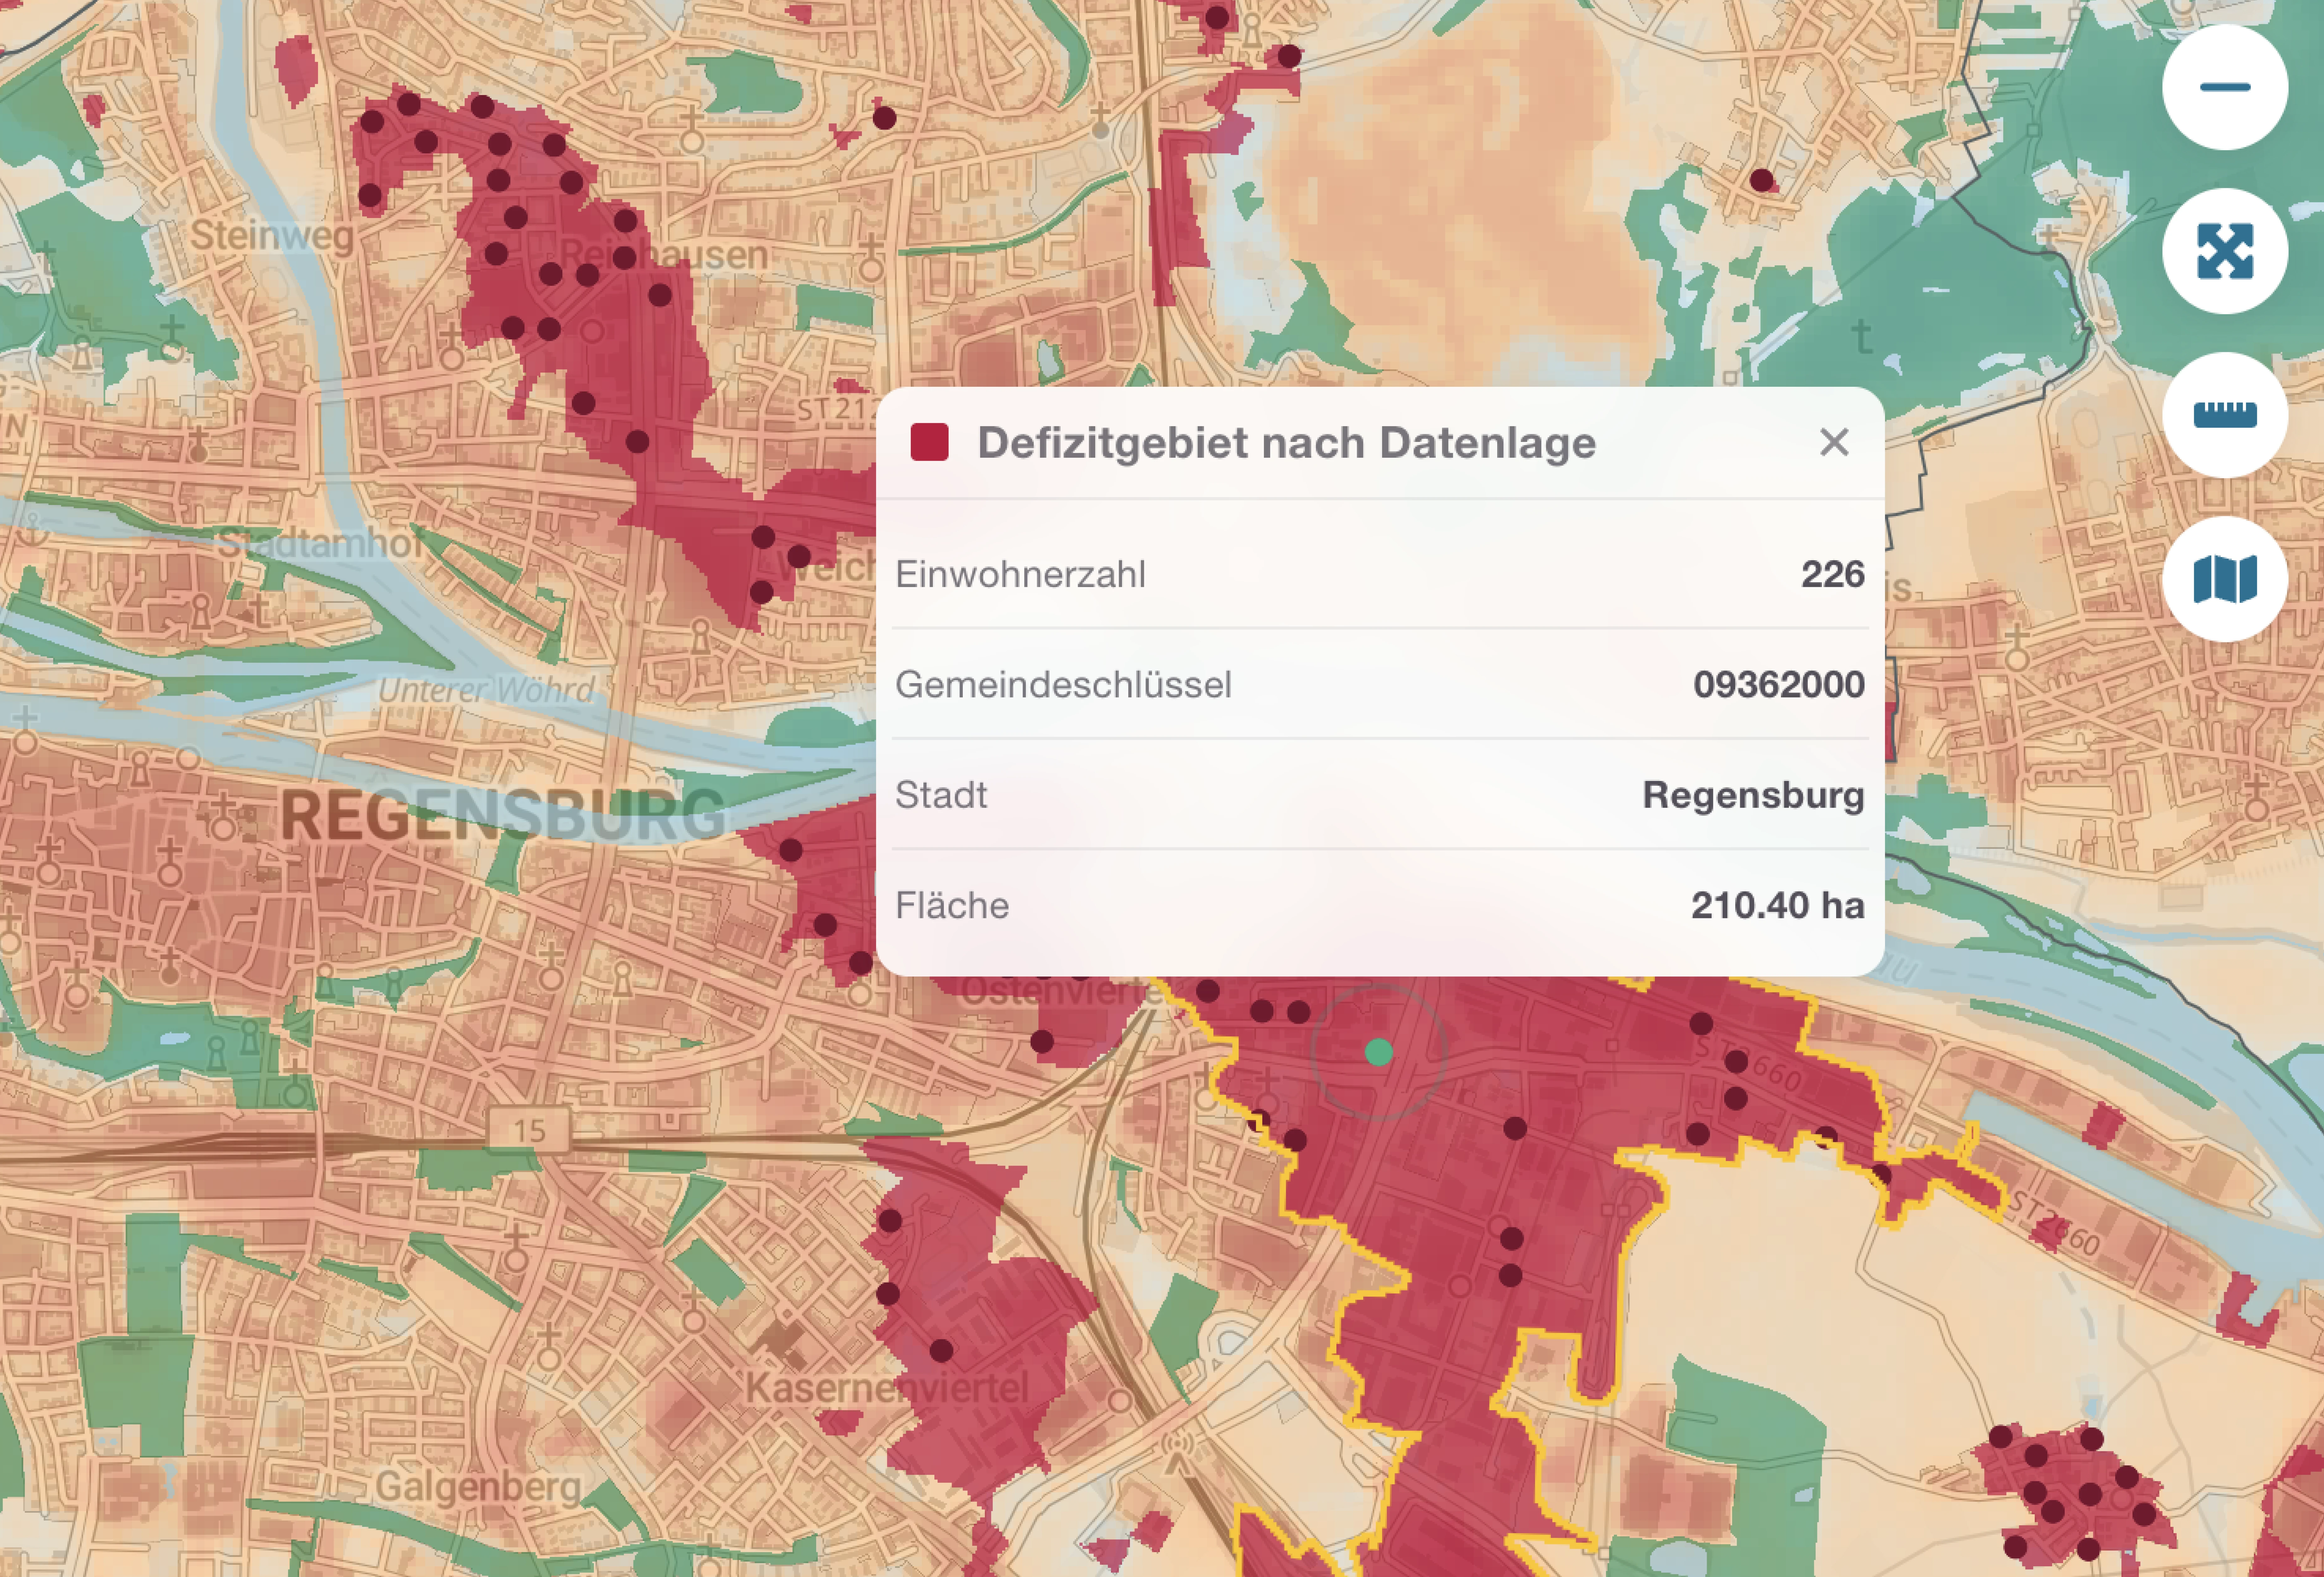
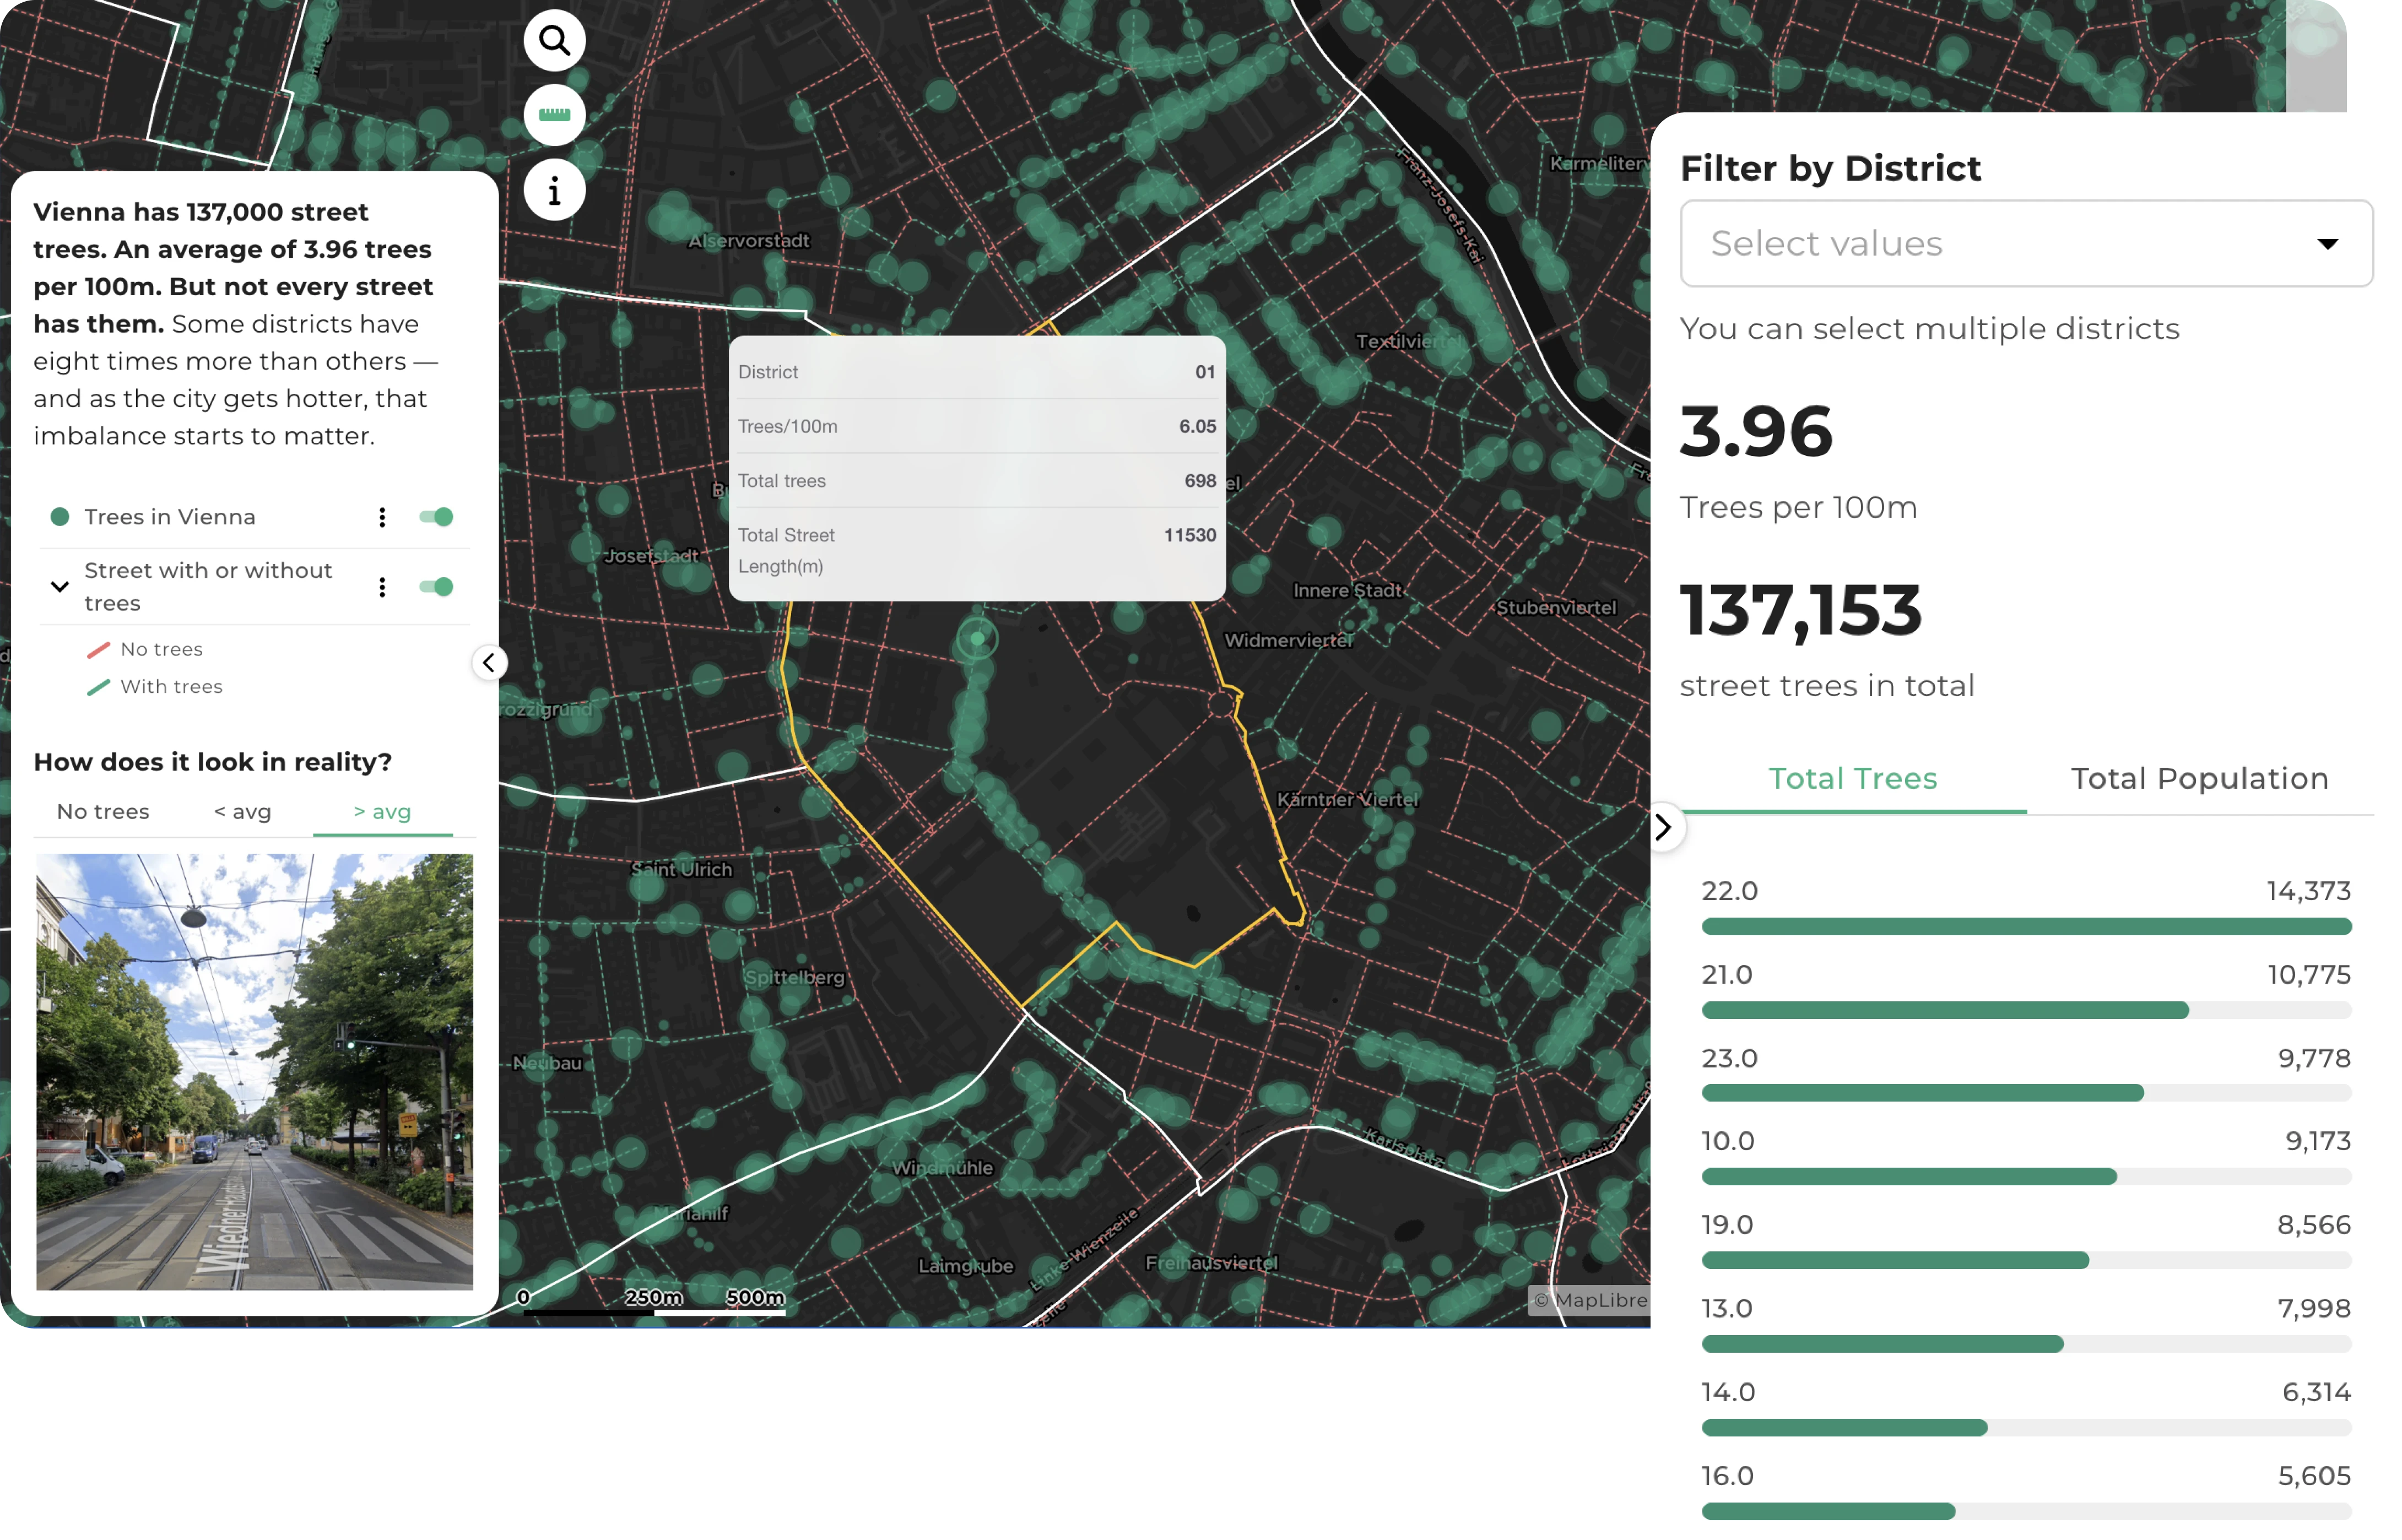
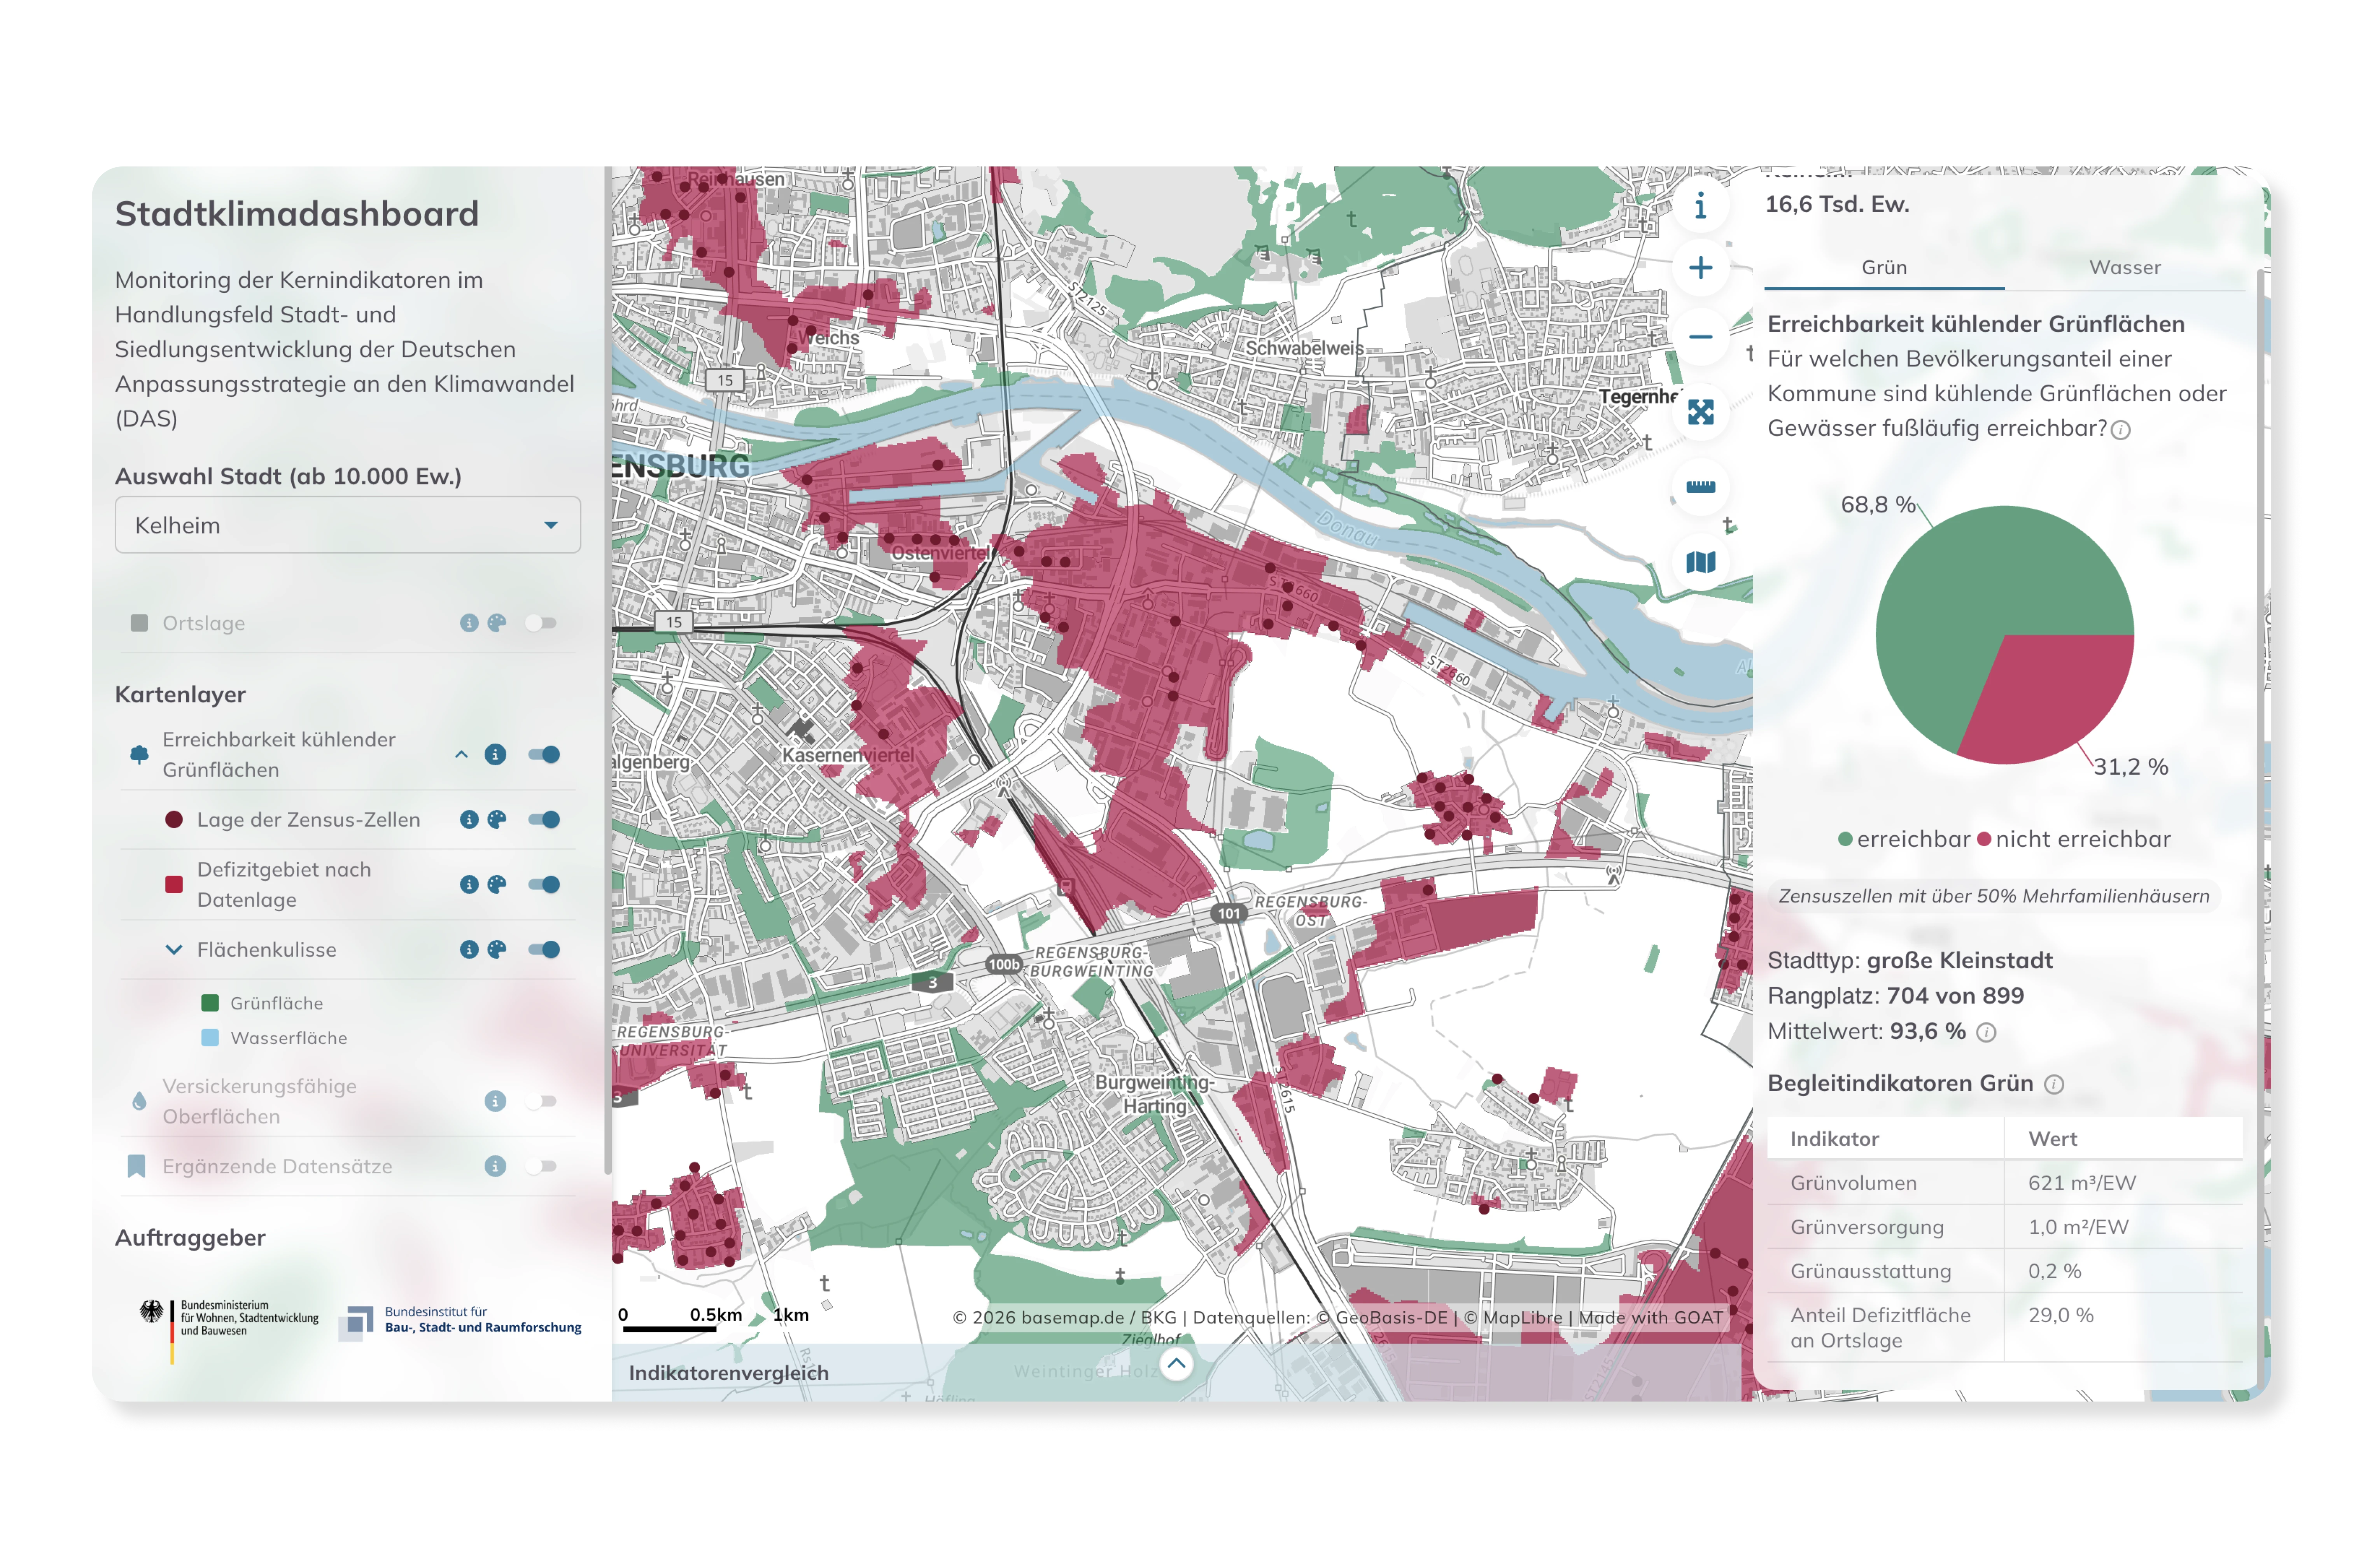
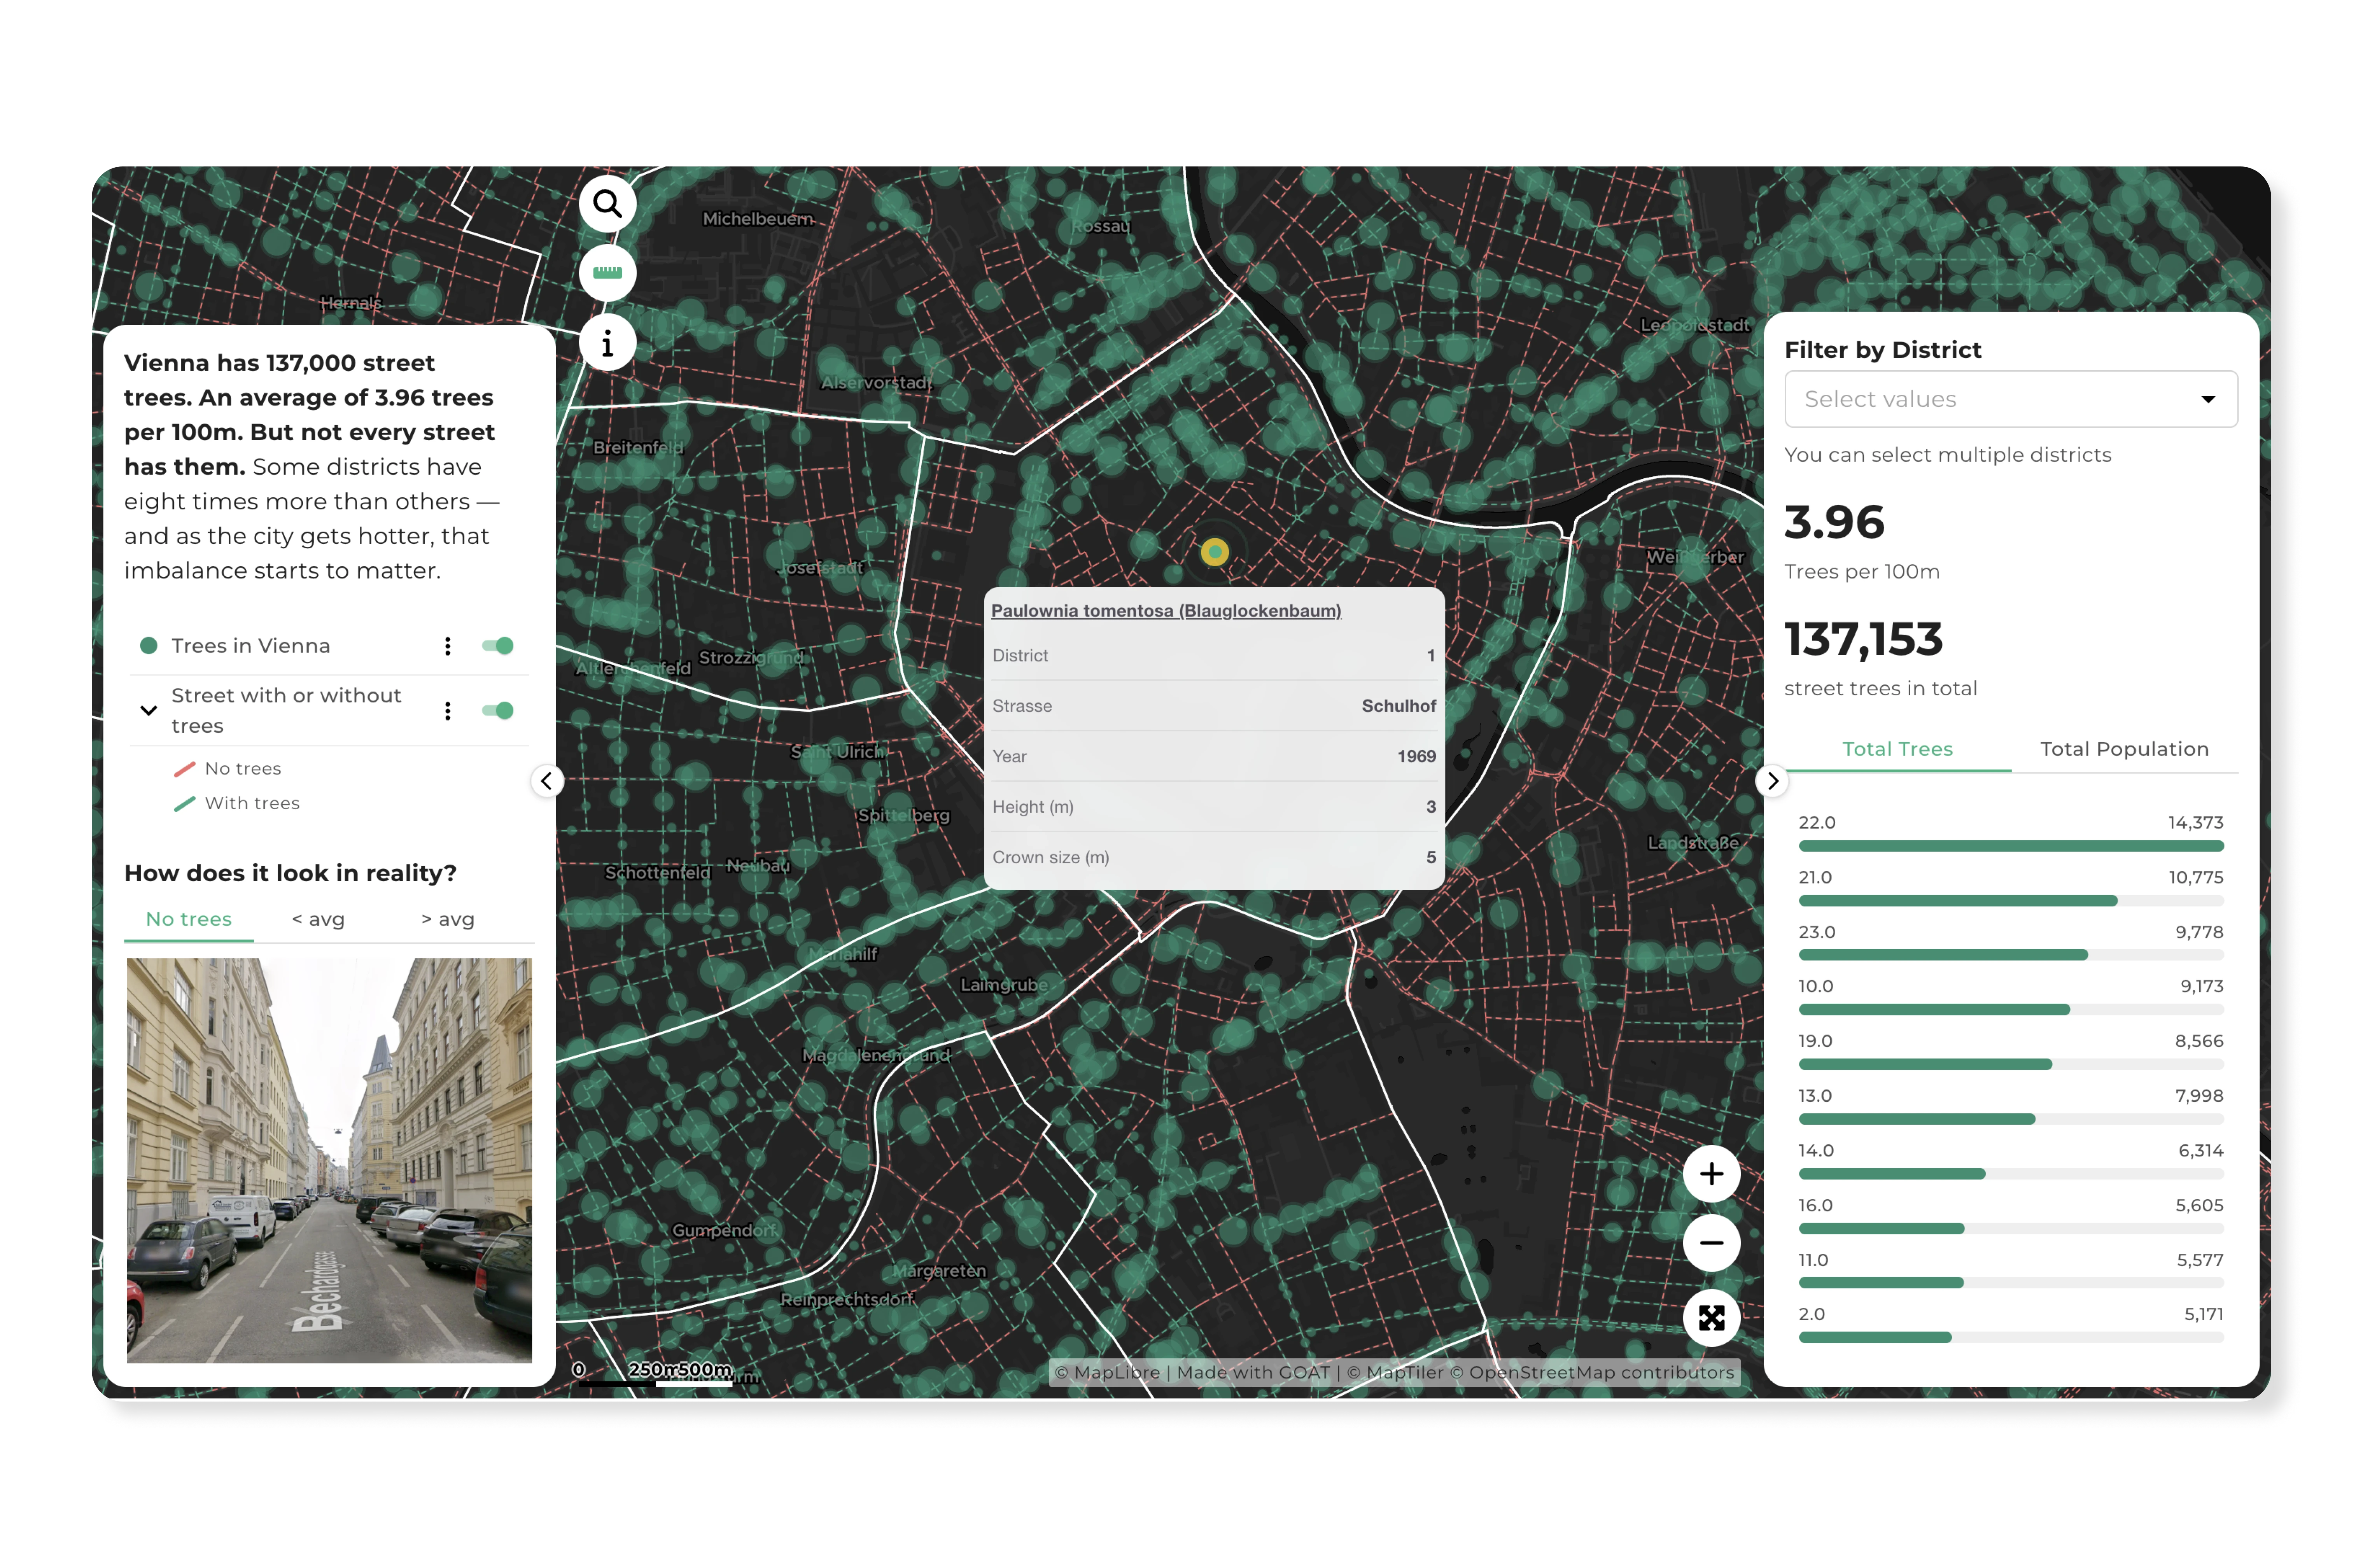
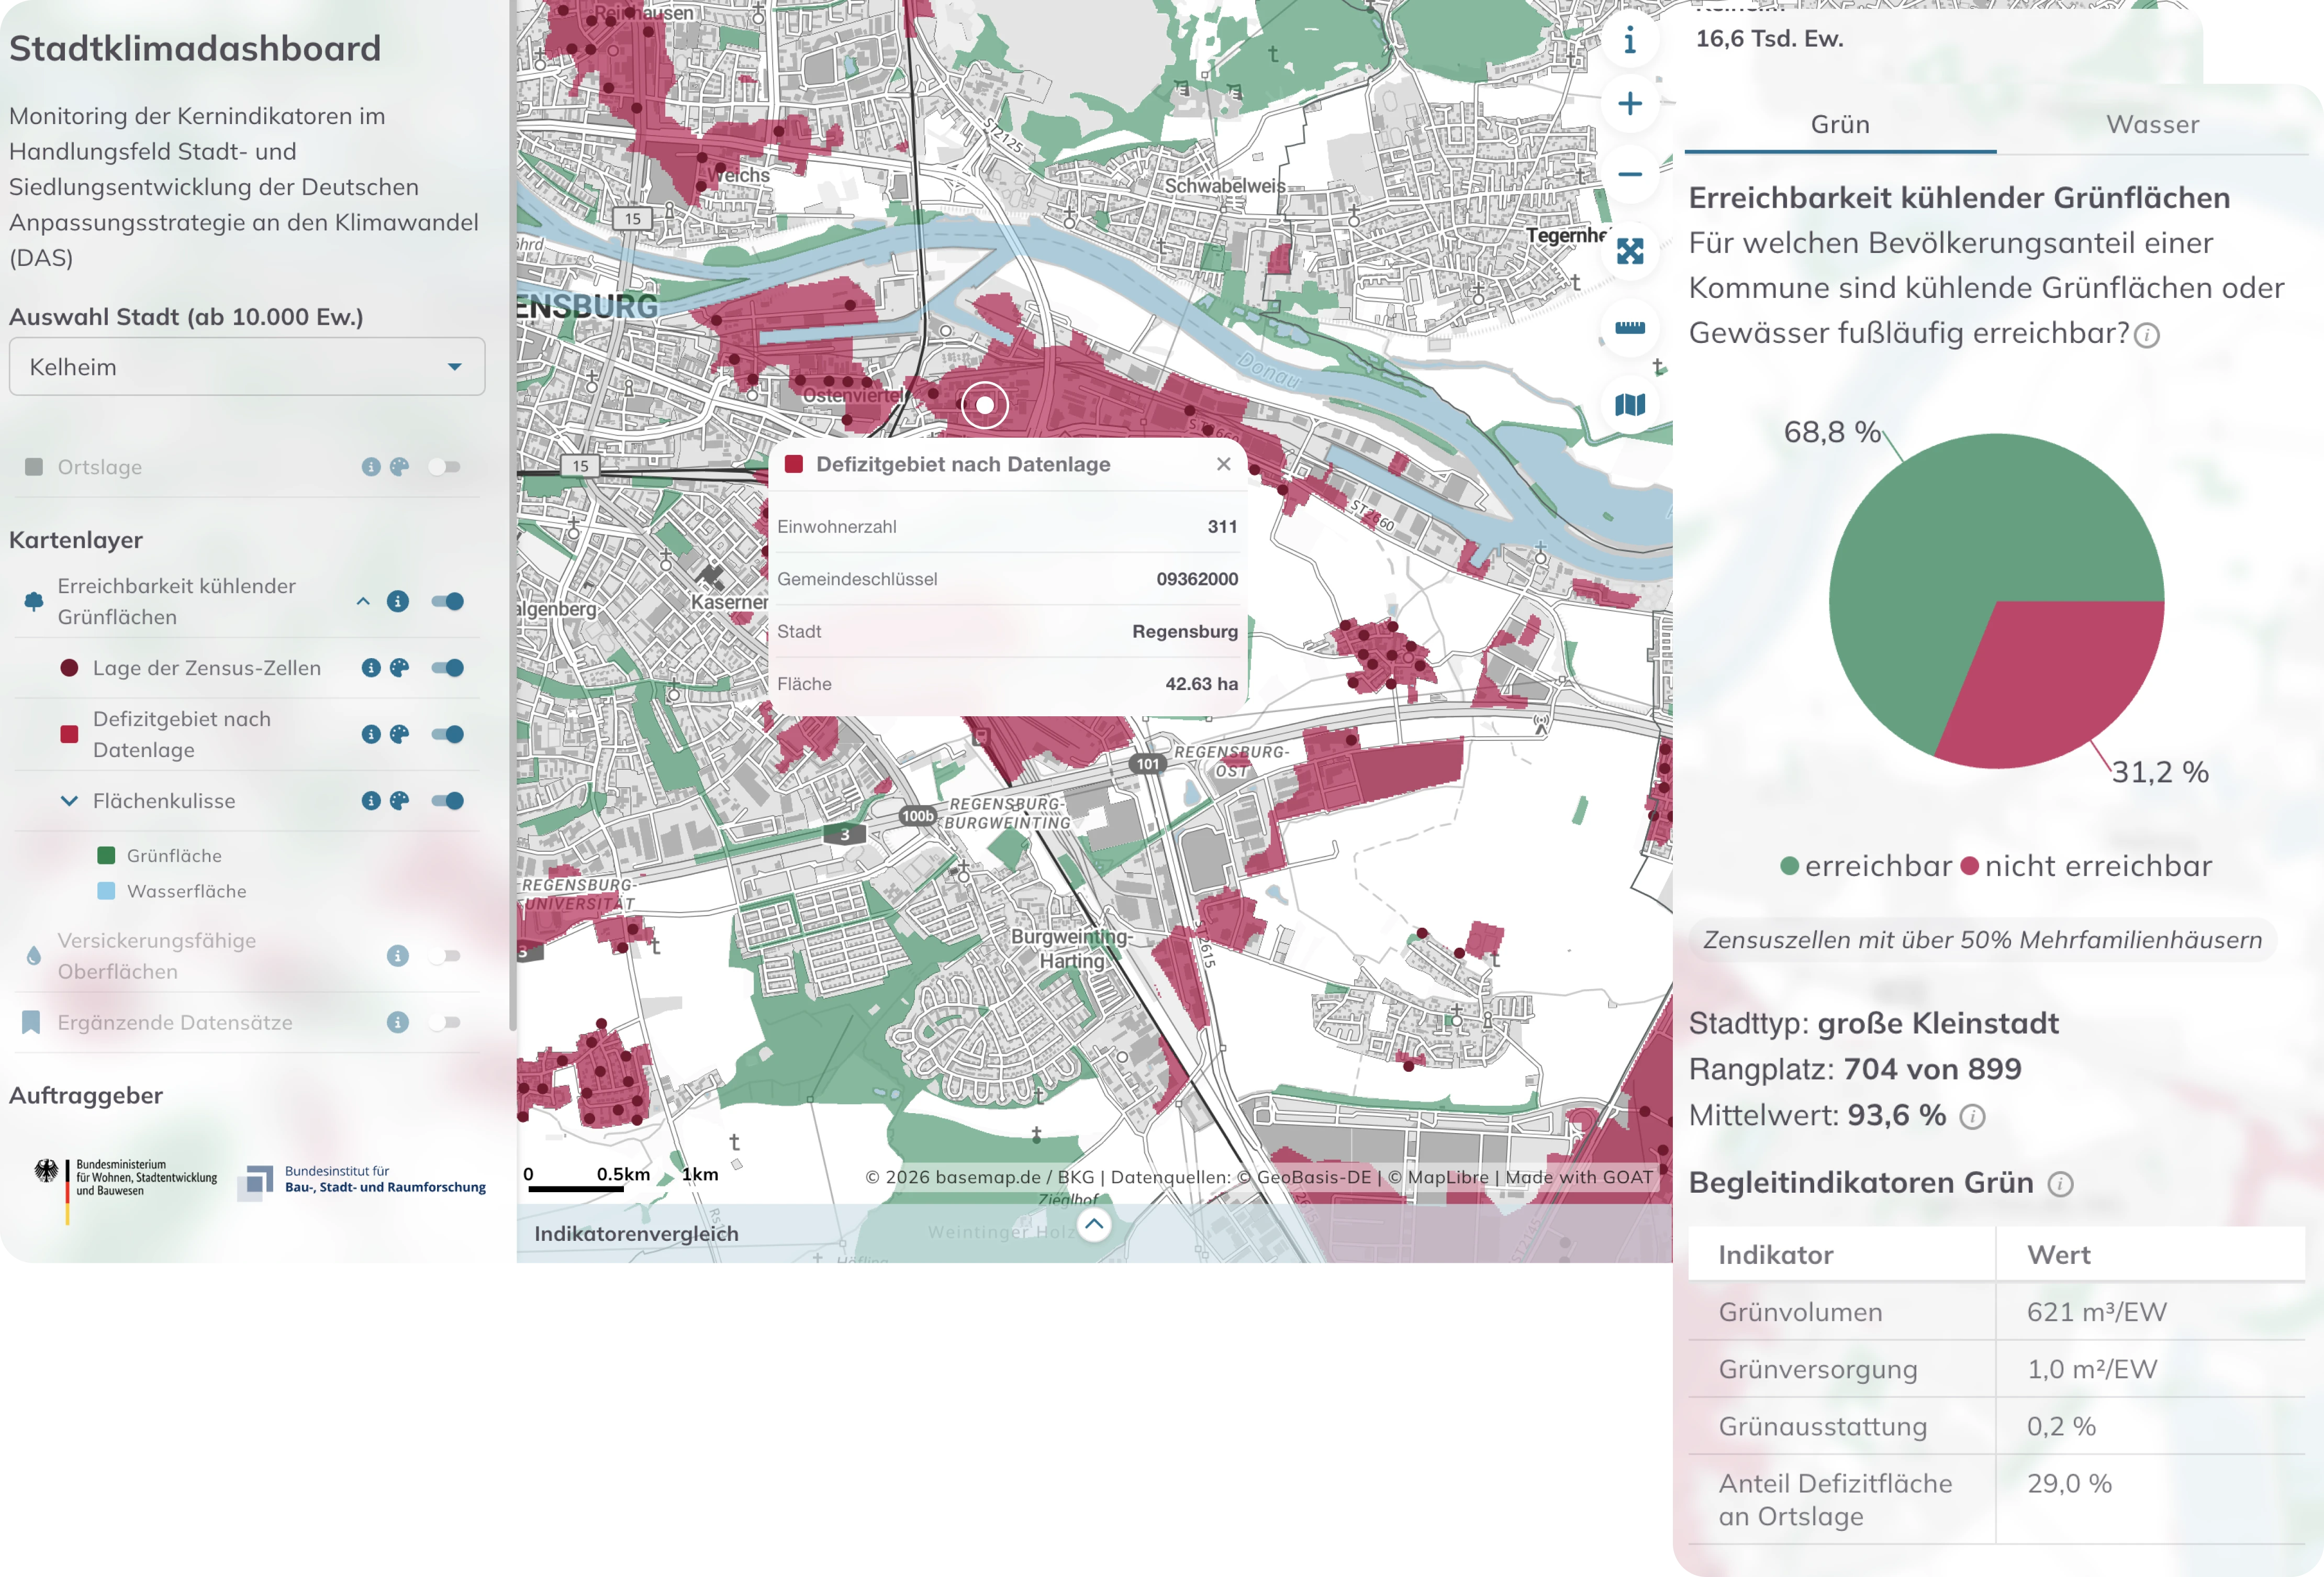
Assess how well residents can reach cooling green spaces — parks, urban forests, and water bodies — on foot or by bicycle, with particular attention to heat-vulnerable populations such as the elderly and children. GOAT's accessibility indicators support the planning and prioritisation of green infrastructure investments in the context of urban heat island mitigation — as demonstrated in Plan4Better's Stadtklimadashboard project for the Federal Institute for Research on Building, Urban Affairs, and Spatial Development (BBSR).
Develop interactive WebGIS dashboards that visualise nationally comparable climate adaptation indicators — such as accessibility to cooling green spaces and permeable surface coverage — to support continuous monitoring of urban climate resilience. GOAT's dashboard and reporting capabilities enable municipalities, state governments, and federal agencies to track progress against climate adaptation strategies and communicate results to stakeholders.
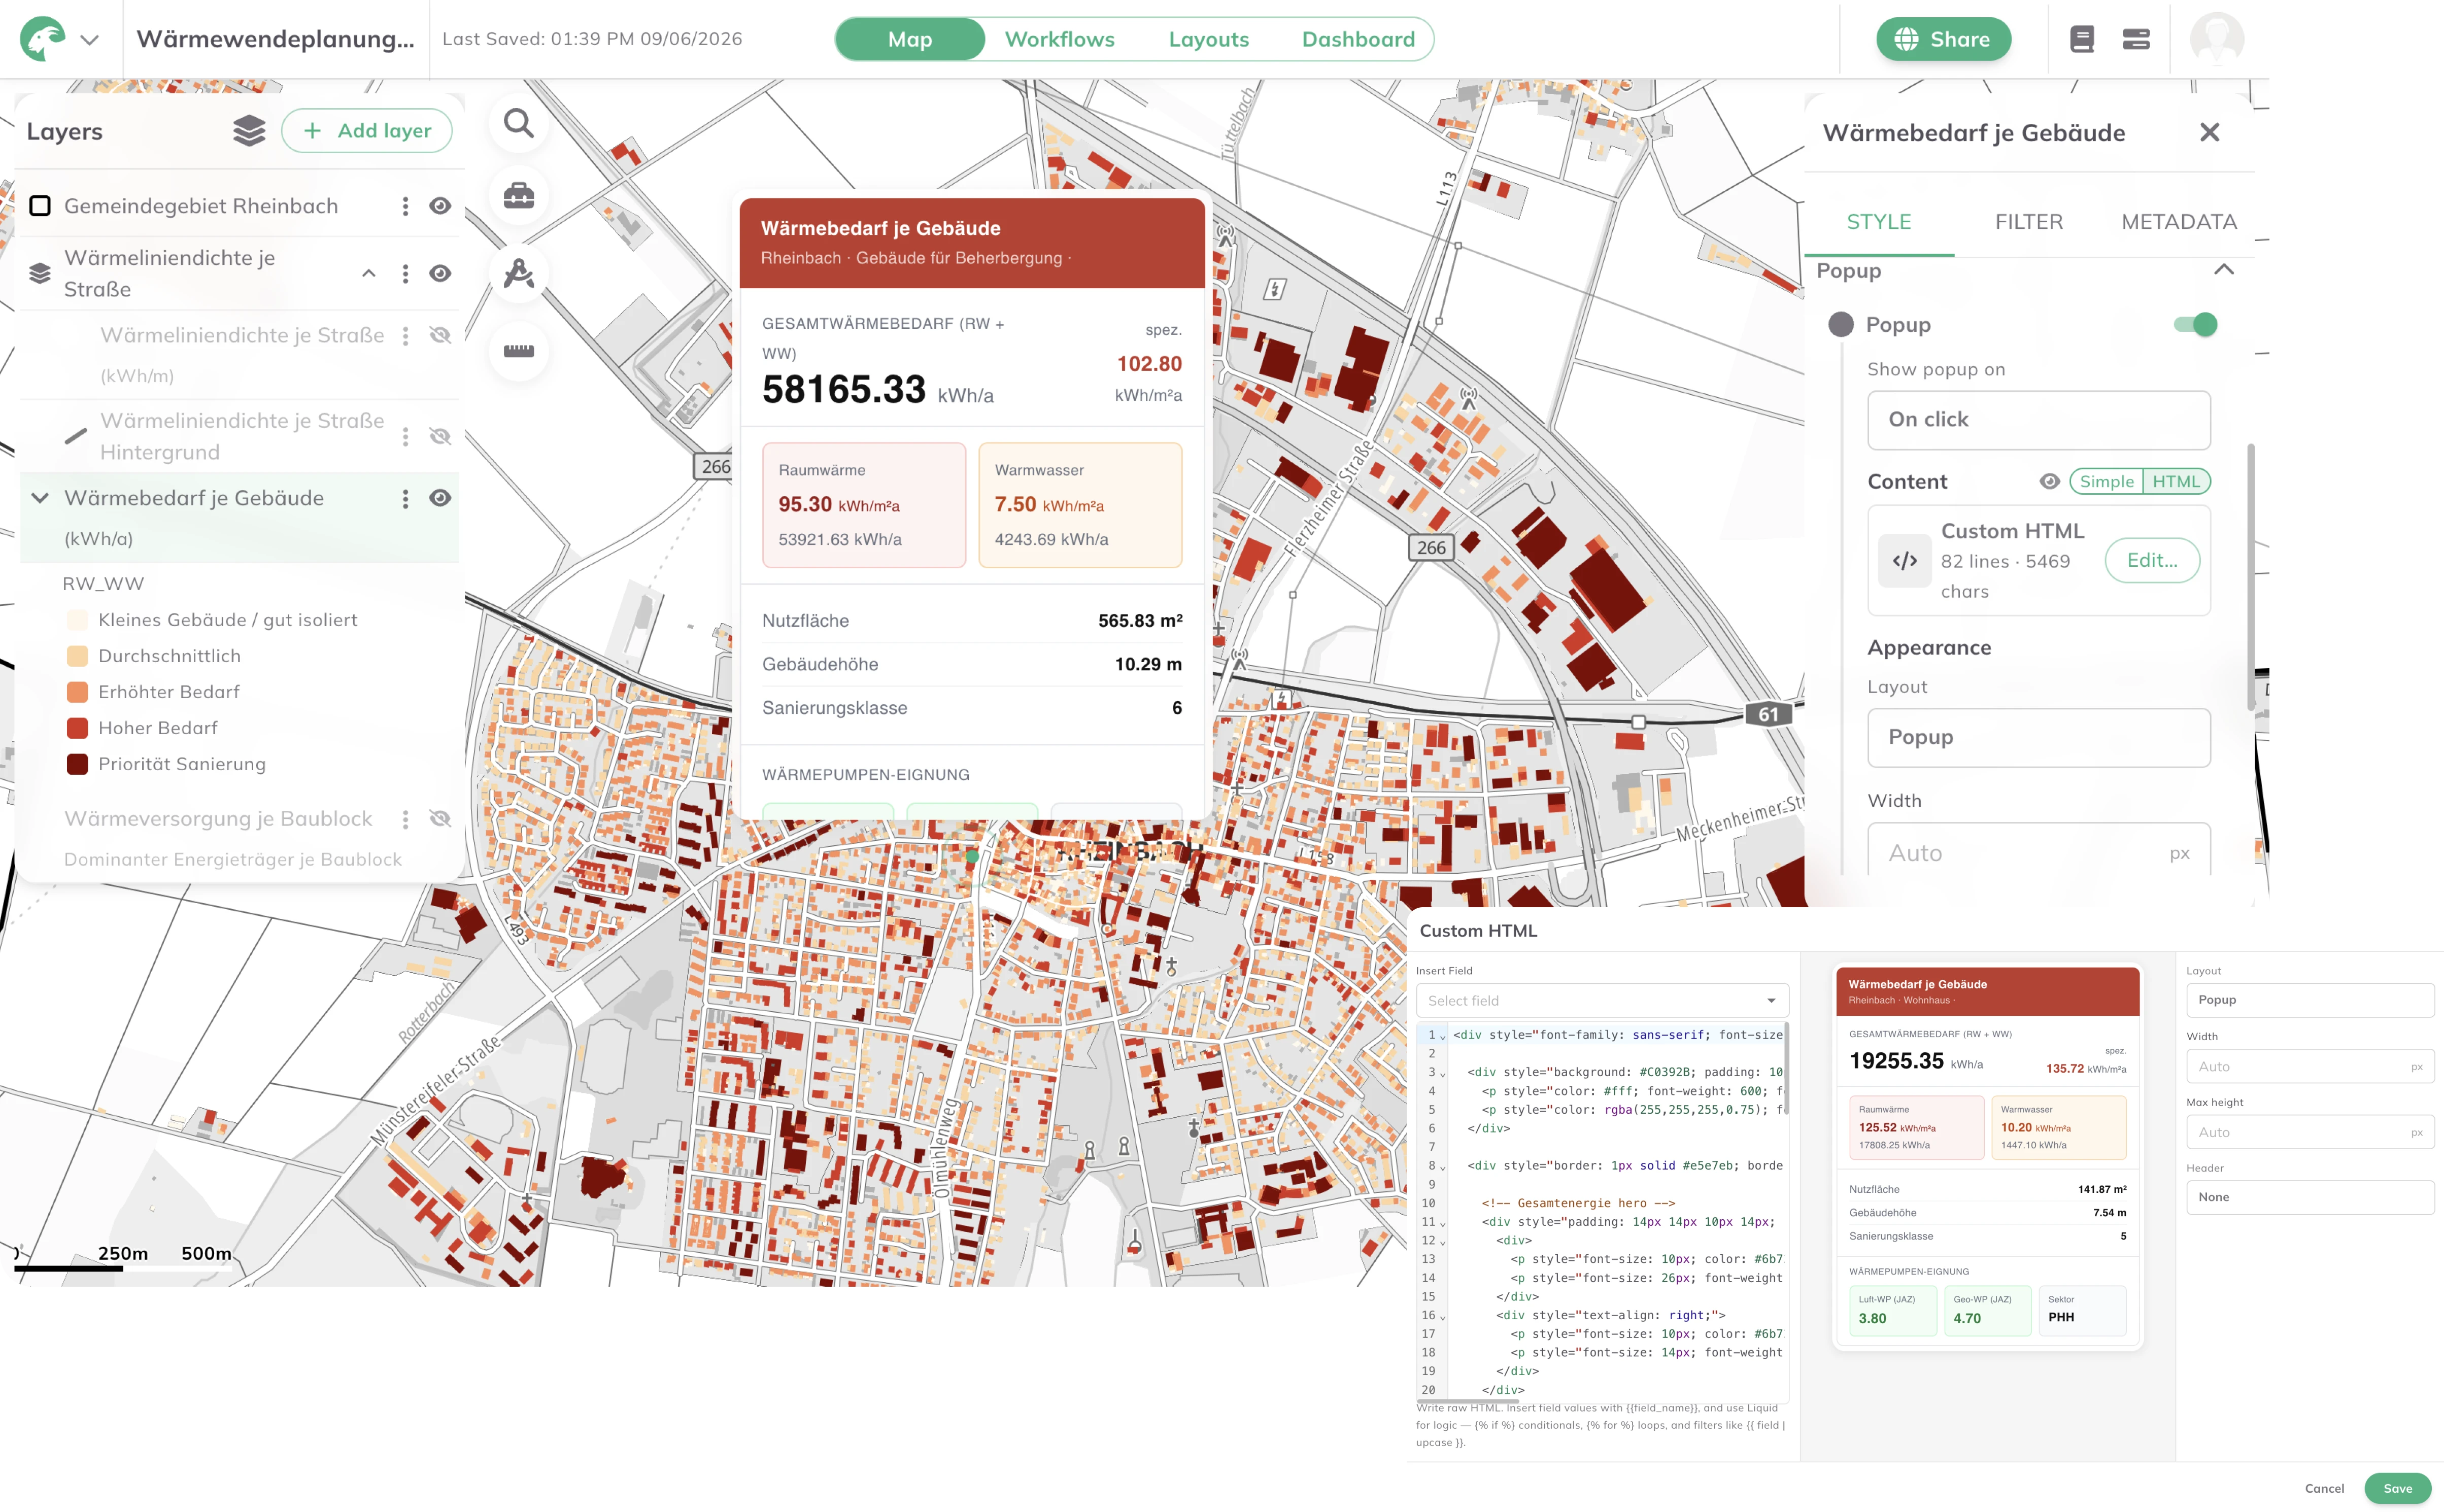
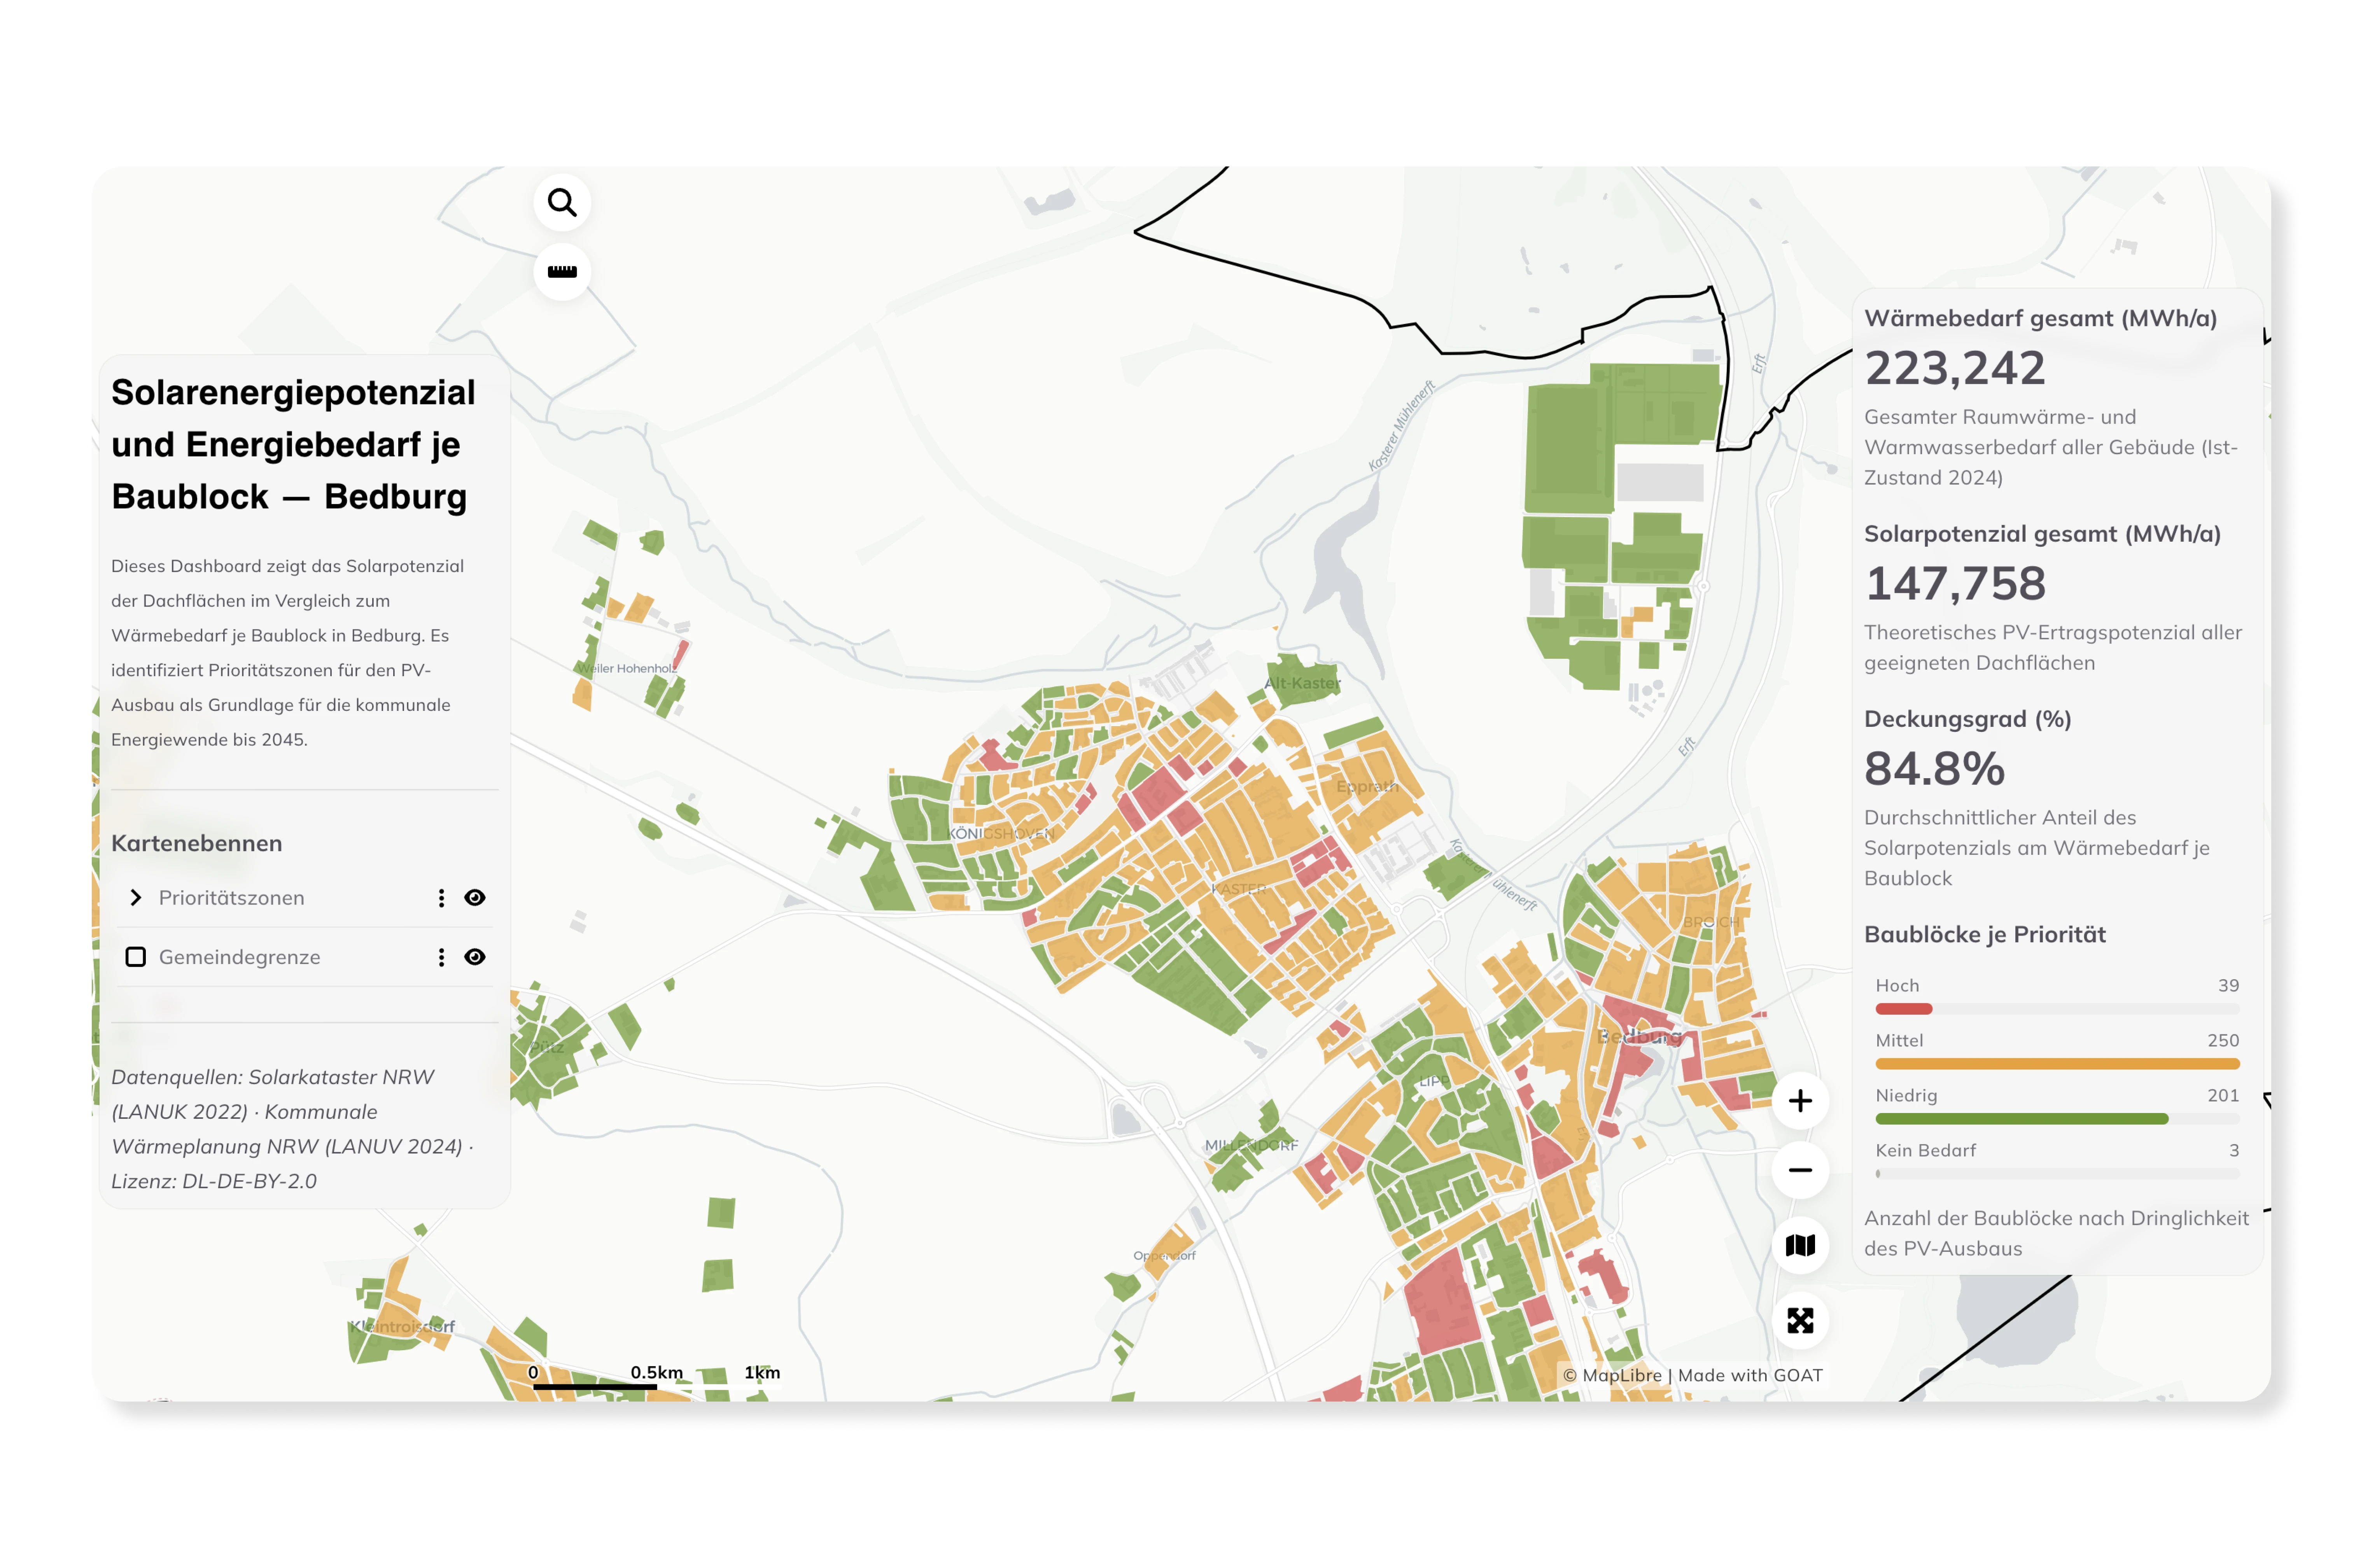
Present climate adaptation analyses and sustainability indicators as interactive maps and dashboards — for use in municipal climate action plans, funding applications, public participation processes, or reporting to regional and federal authorities. GOAT makes complex environmental data accessible and visually compelling for non-specialist audiences including politicians, citizens, and investors.
Real analyses built by planners, researchers, and cities — explore what’s possible before you start your own.
green space accessibility, sustainable mobility, and urban heat indicators in one platform
cloud-based SaaS with no installation or IT overhead
cloud-based SaaS with no installation or IT overhead
built on open-source technologies, open data standards, and an Open Science approach
from a single neighbourhood assessment to a nationwide climate monitoring platform
used for climate adaptation research and sustainable urban planning projects across Germany, including projects funded by the Federal Ministry for Digital and Transport and the BBSR

.jpg)
.jpg)
Join planners and cities already using GOAT to make better decisions, faster.