Energy
Sustainability & Climate Risk
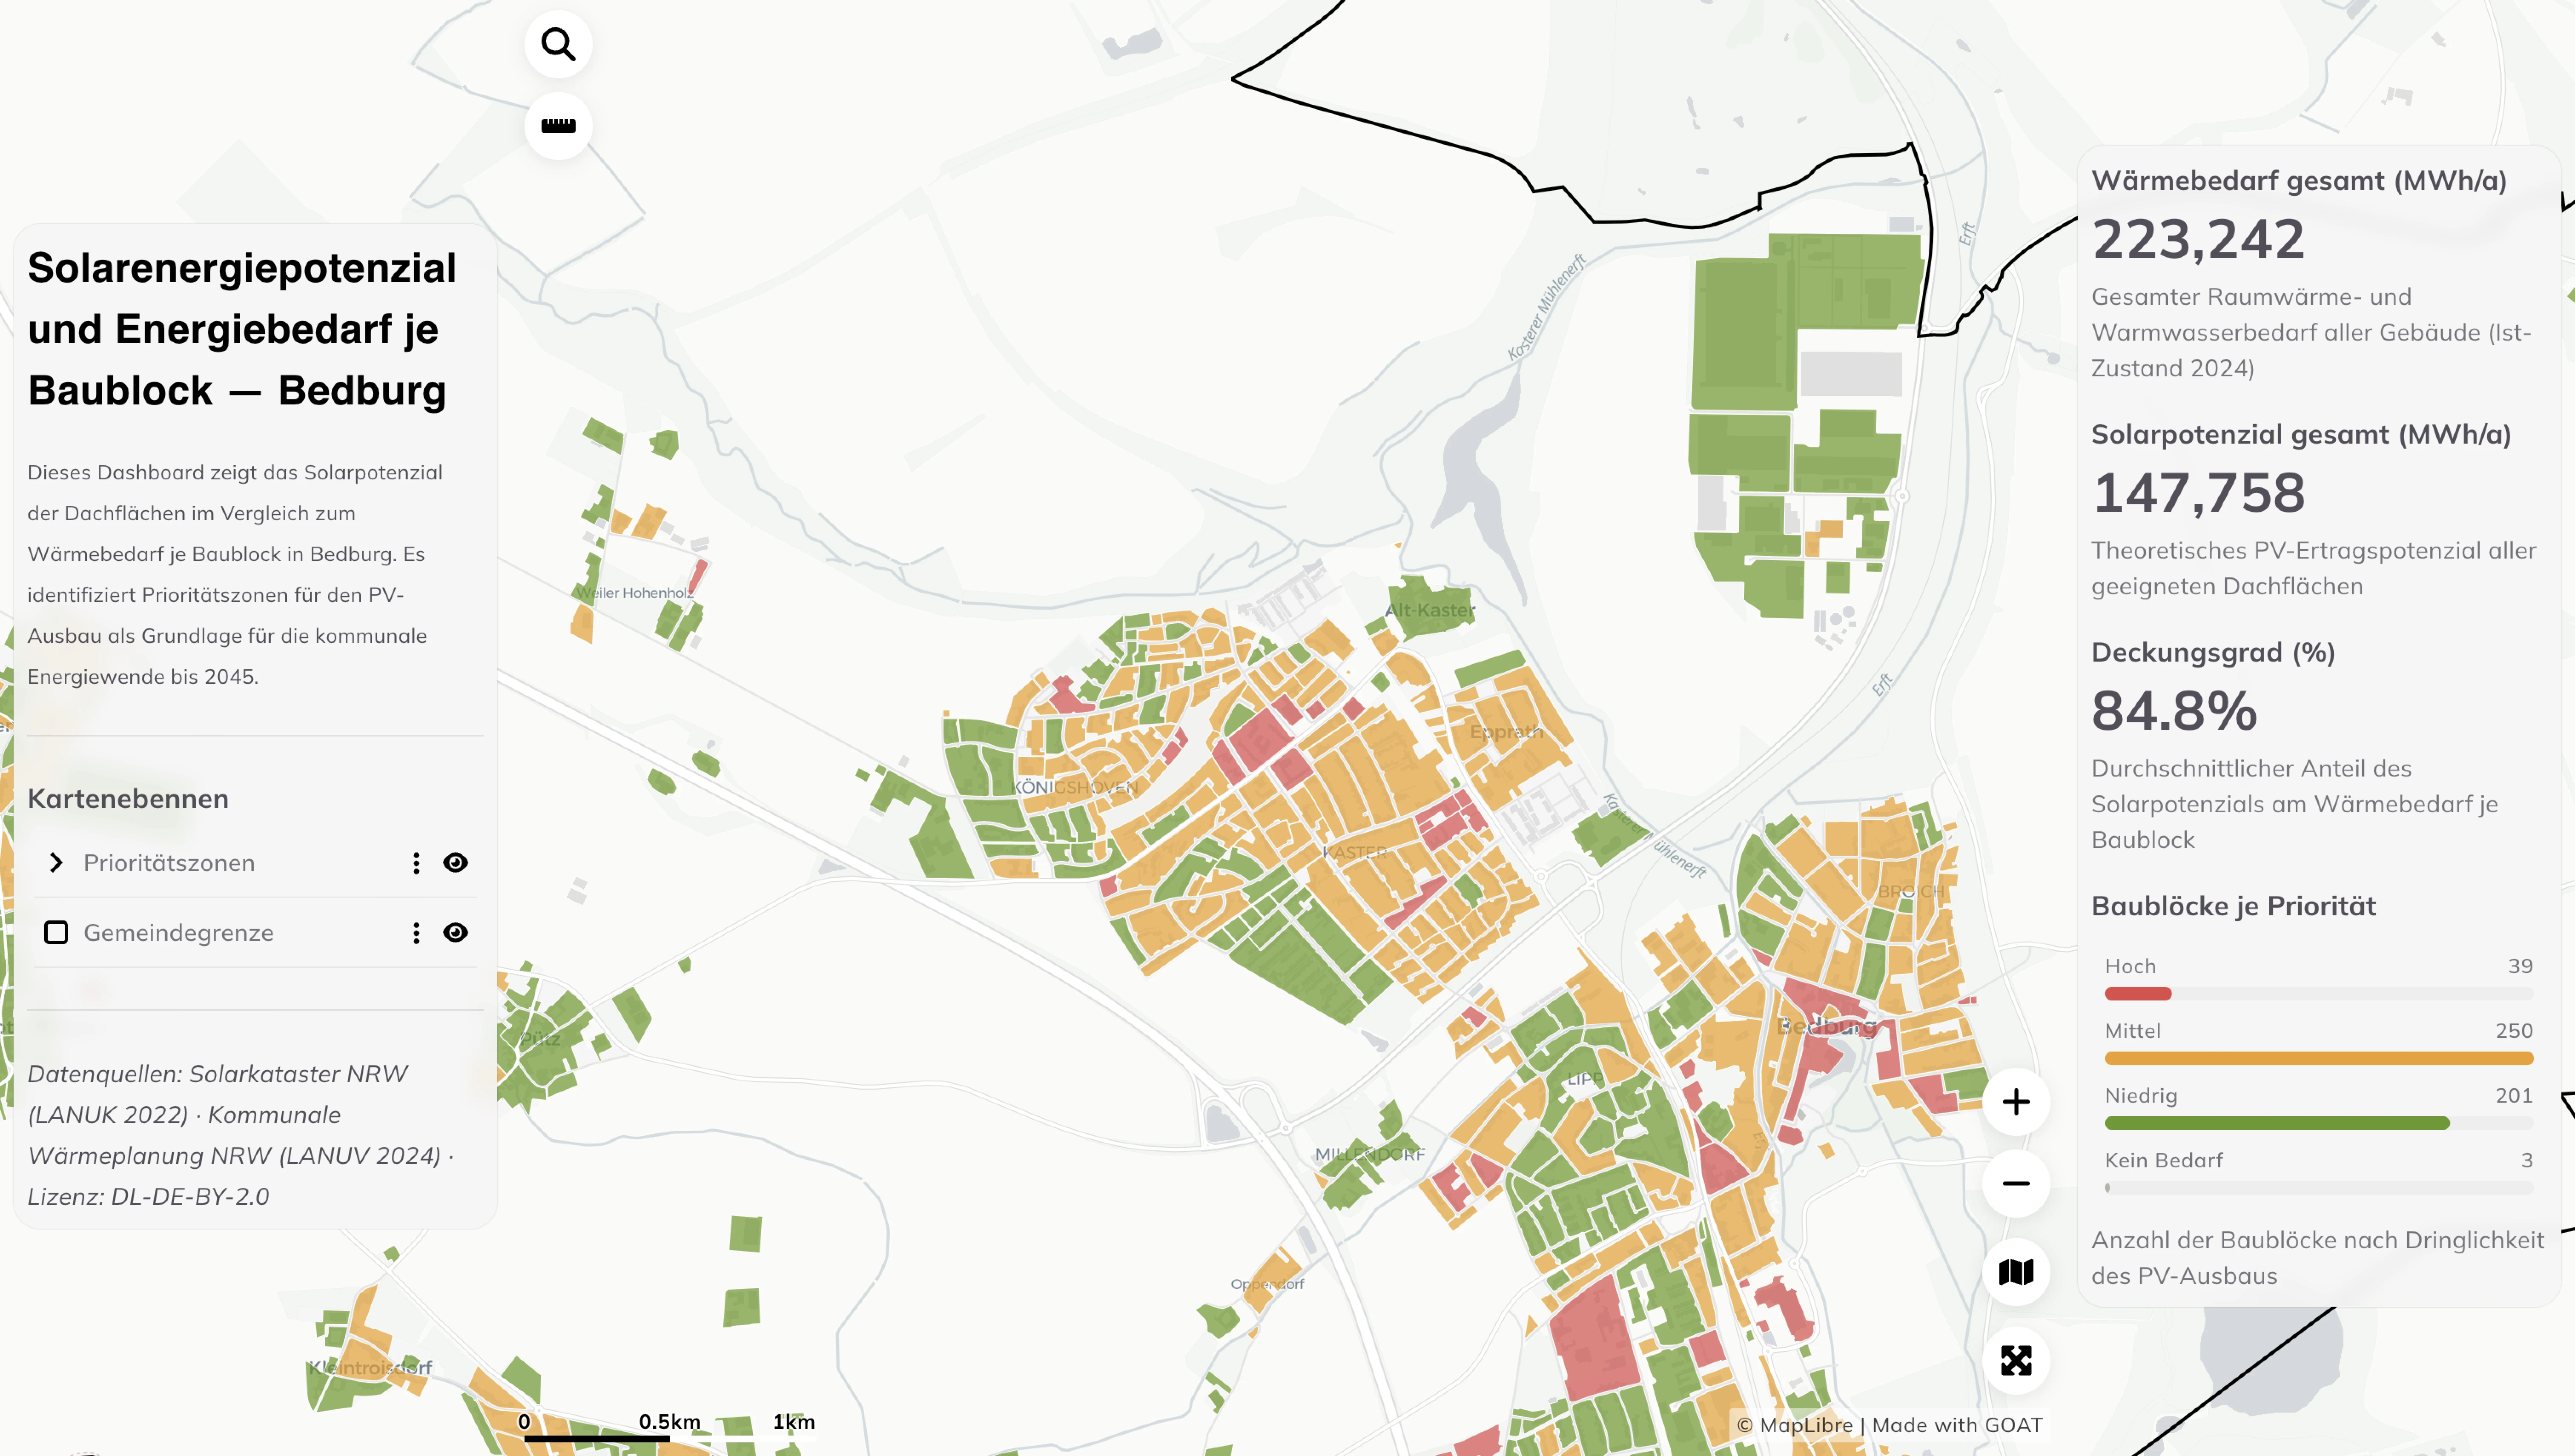
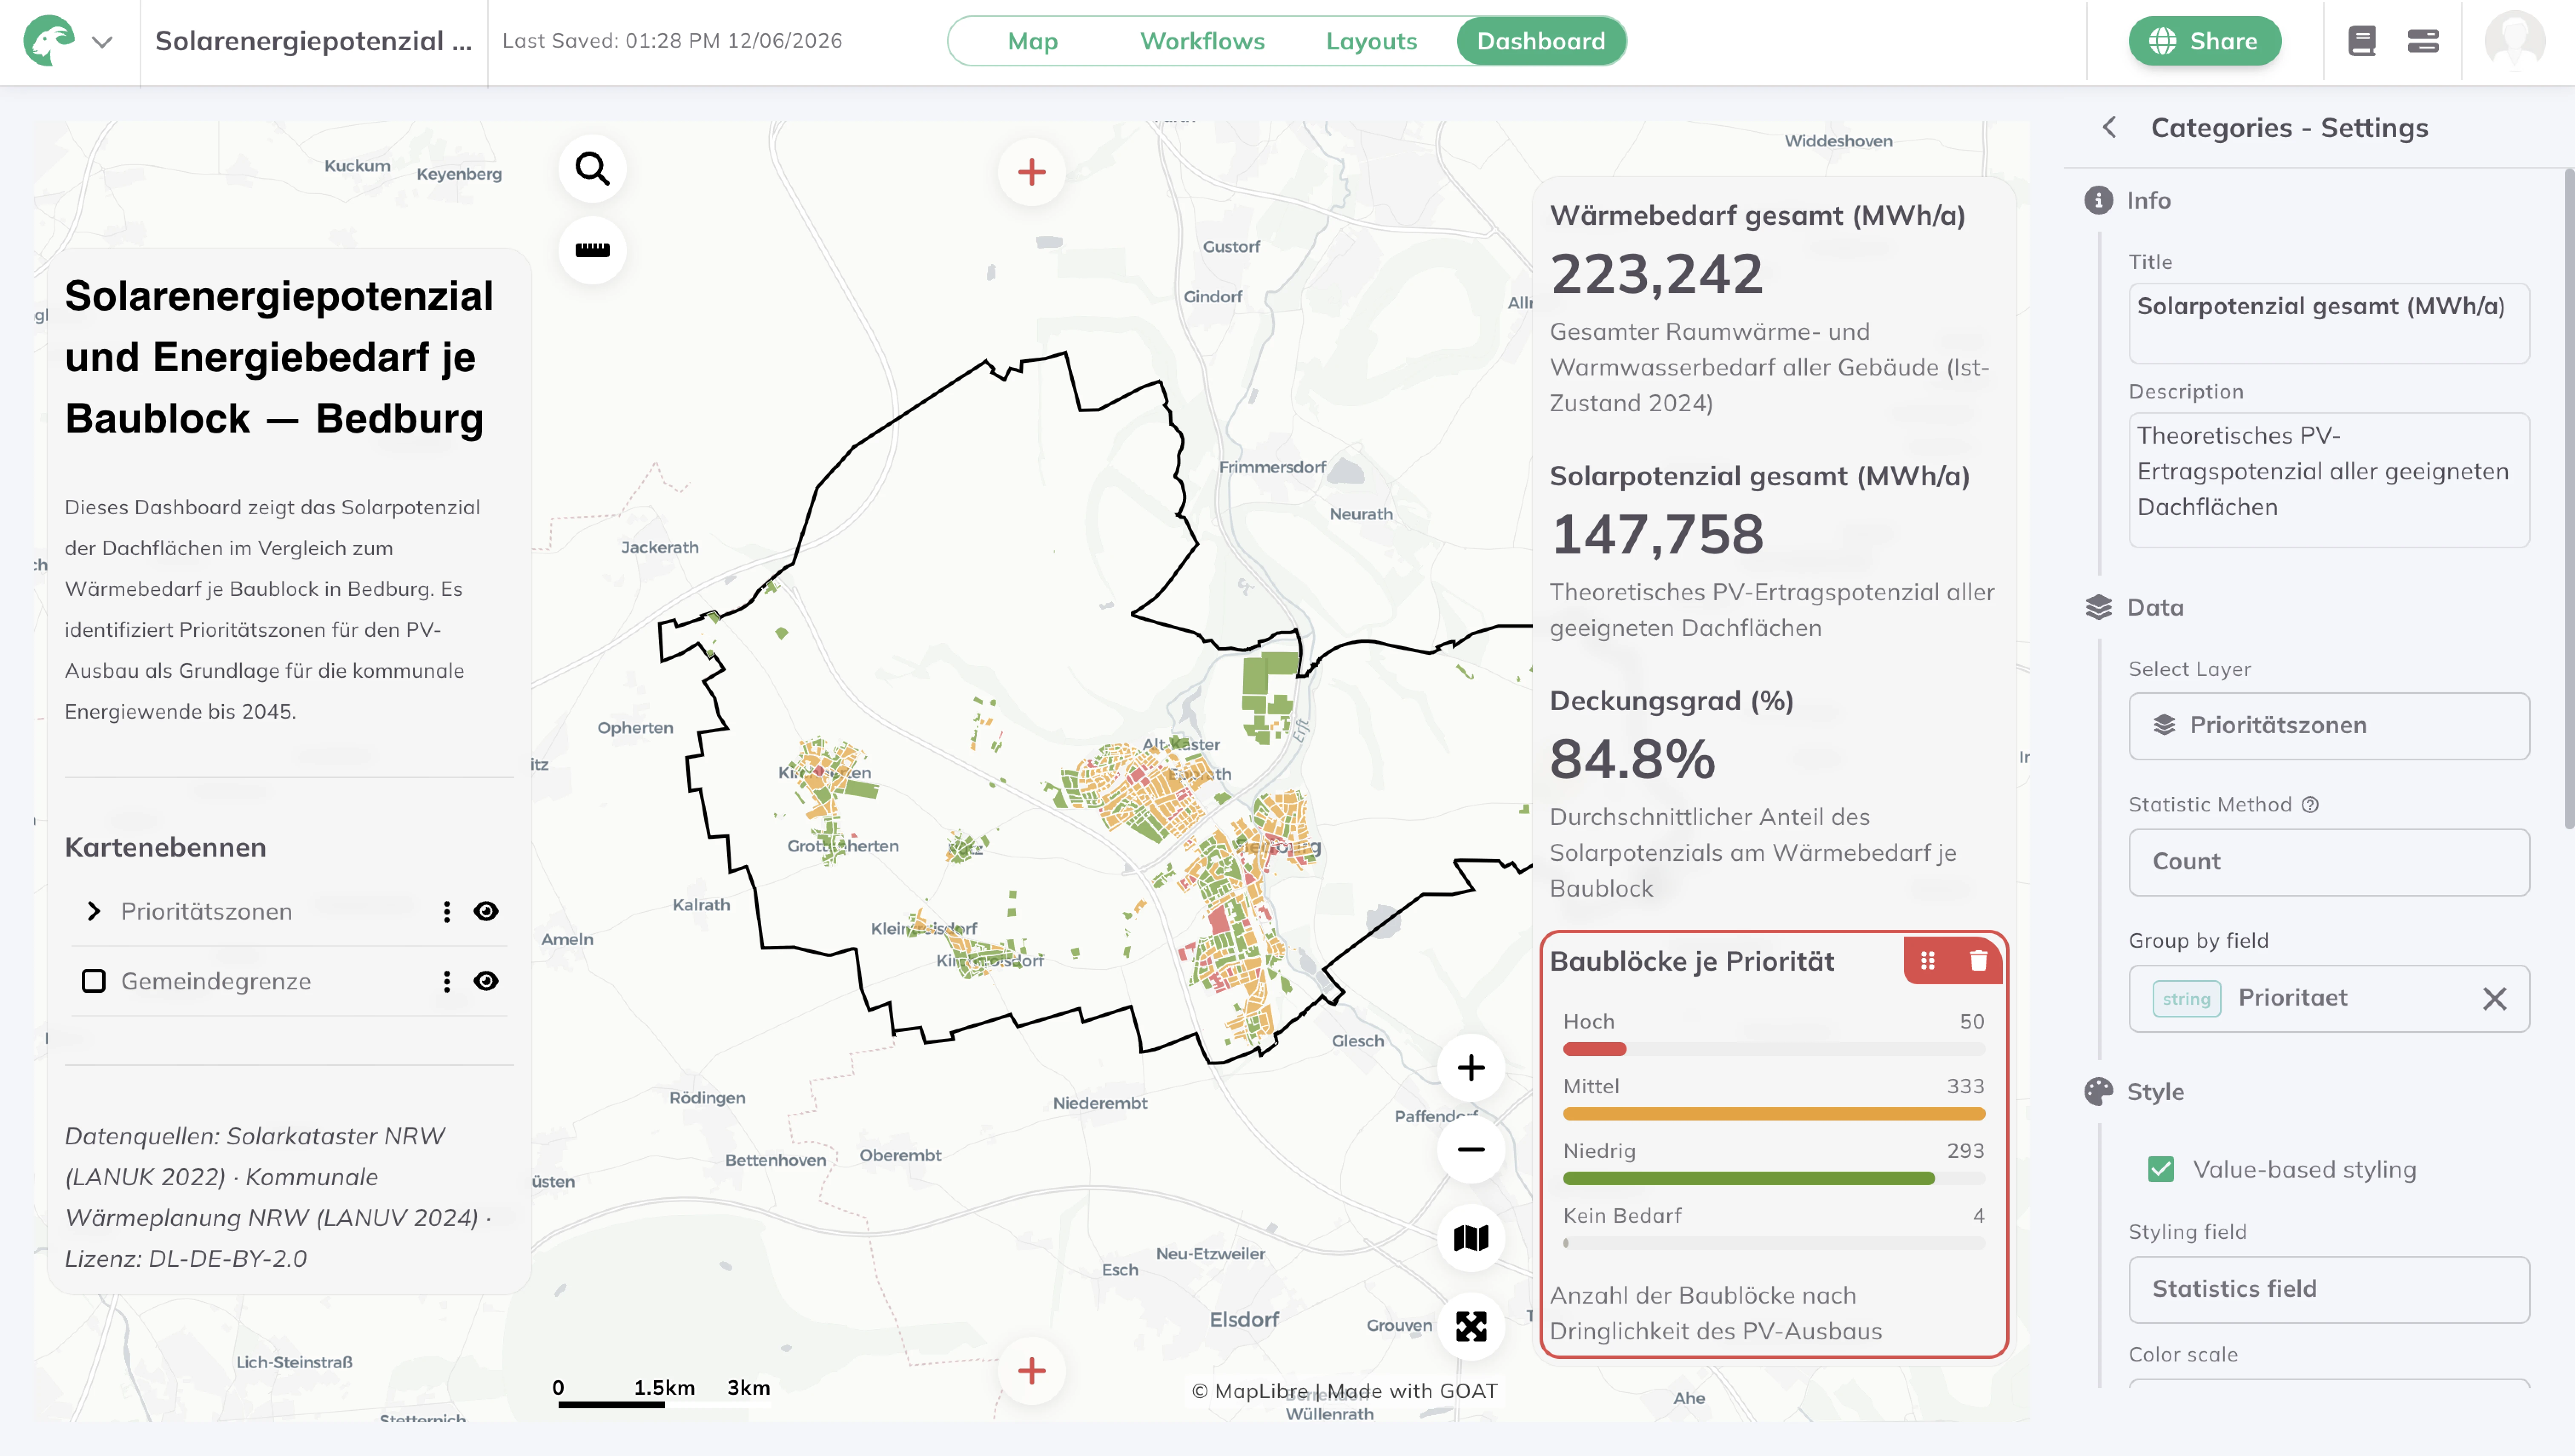
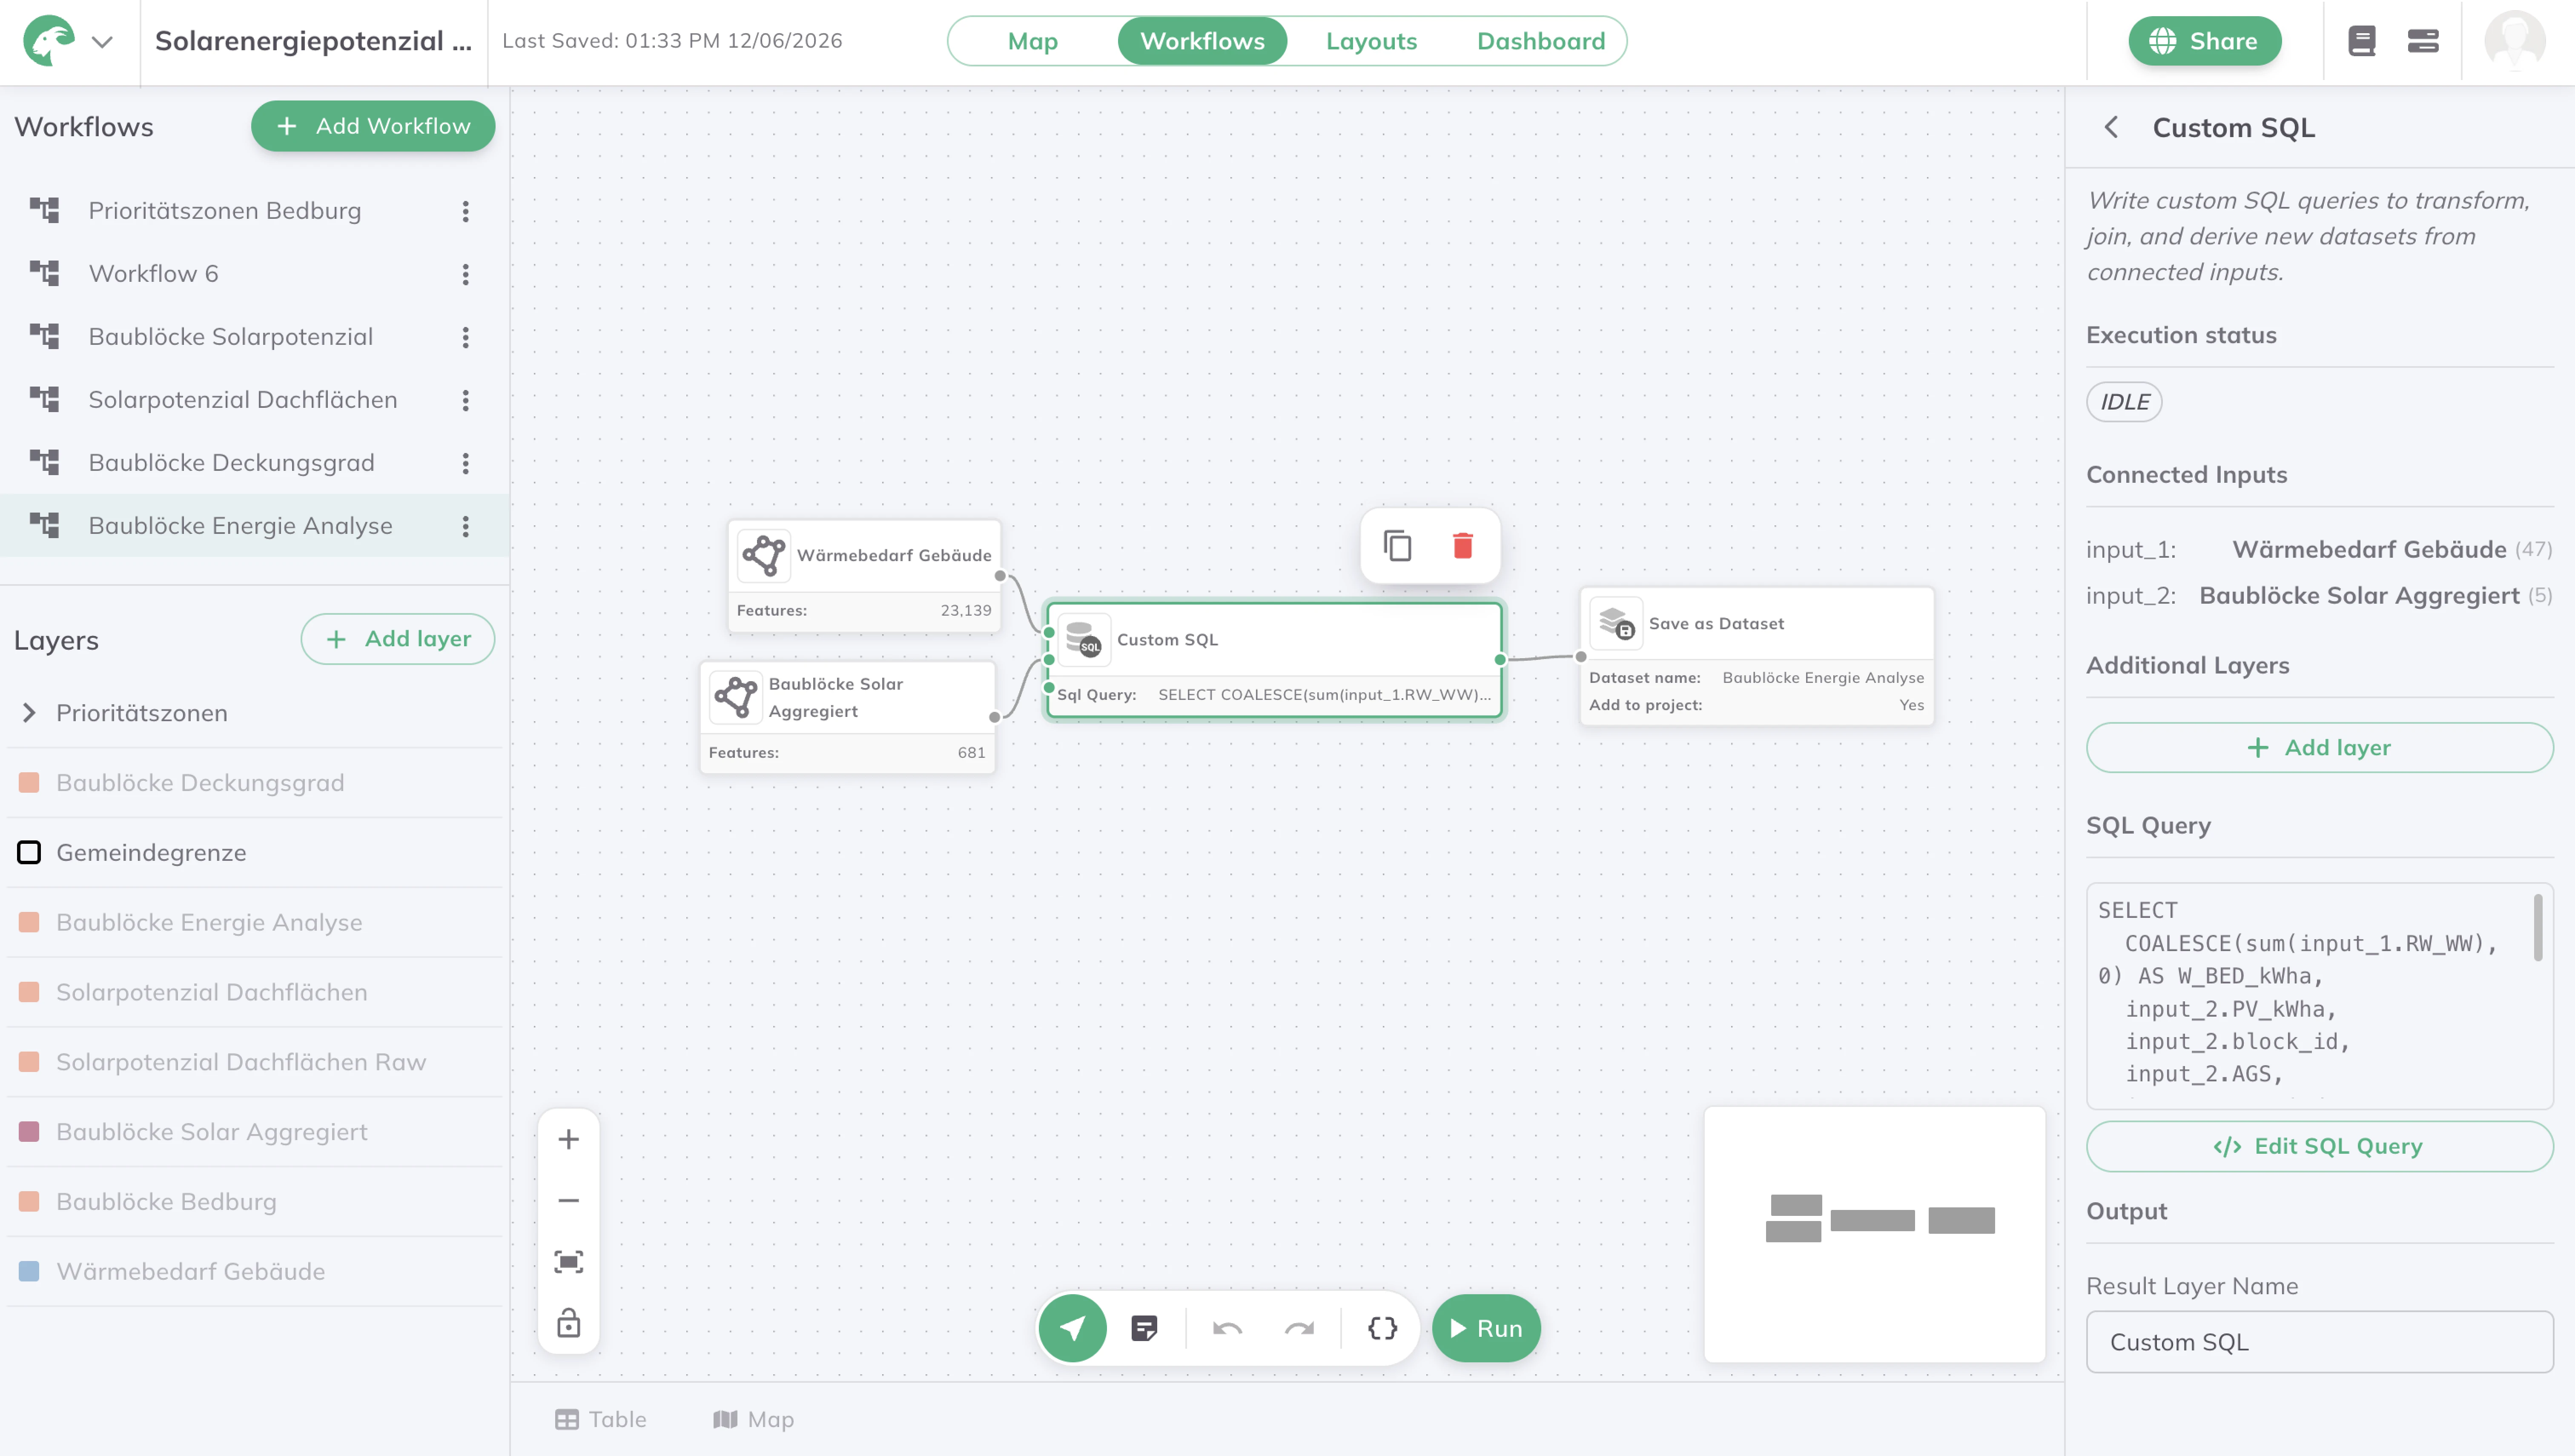
How much of a city's energy demand could its own rooftops cover? This dashboard sets the solar potential of Bedburg's roofs against the heat demand of each city block — showing where generation and consumption line up, and where they don't. From that comparison it derives the priority zones for solar expansion: the blocks where investing in PV would do the most for the local energy balance. As a foundation for the municipal energy transition to 2045, it turns scattered building and solar data into one clear, block-level map that municipalities, utilities, and energy planners can act on.

.jpg)
.jpg)
Join planners and cities already using GOAT to make better decisions, faster.