
GOAT v3.0: 30,000 datasets, project templates, and your own routing network
The Catalog grew from 60 datasets to more than 30,000, projects now start from templates instead of an empty map, content management has been rebuilt, and accessibility analyses can run on a network you bring yourself.

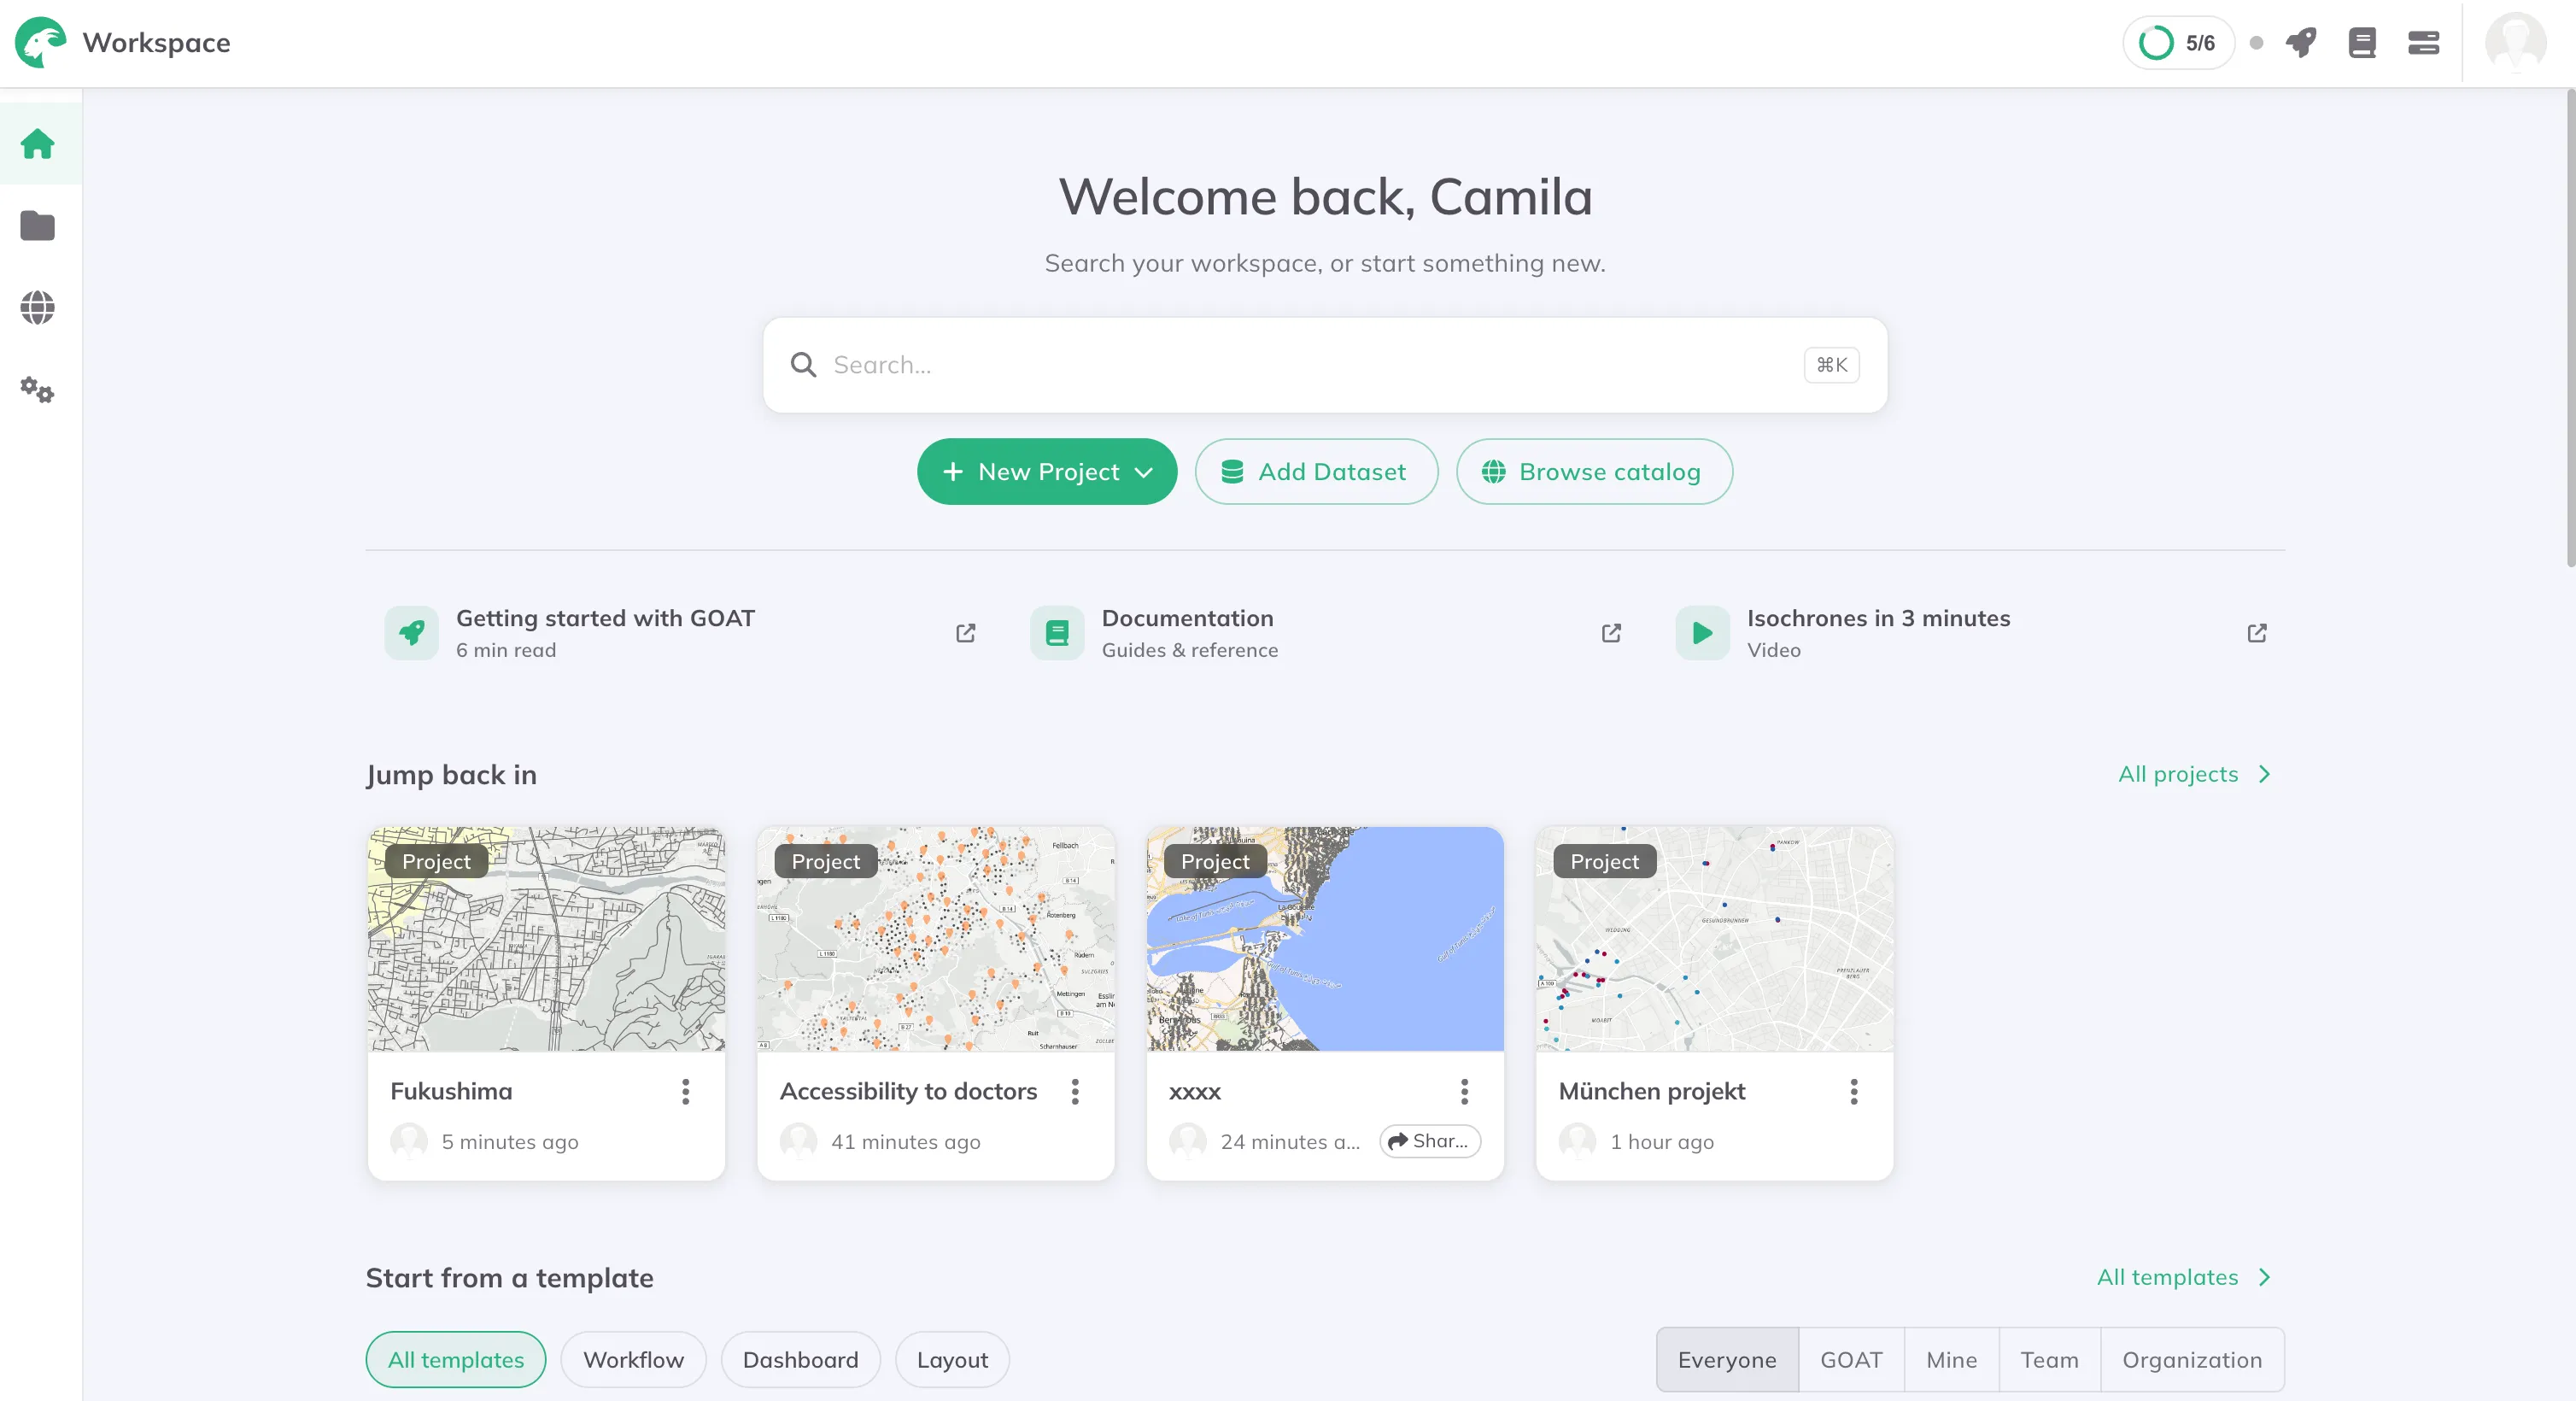
GOAT v3.0 is out. Updates have been quiet for a few months, because we were building towards this one.
Four things changed, and all four touch the everyday work: where your data comes from, how quickly a project can start, how you manage data and projects once they exist, and which network your routing runs on.
1. The Catalog: from 60 datasets to more than 30,000
Until v3, the Catalog held around 60 datasets. Each one was found, checked and added by hand. It was useful, and it was small. A project that needed anything outside those 60 started the same way most GIS projects start: searching for a portal, working out the licence, downloading, reprojecting, cleaning.
In v3 the Catalog holds more than 30,000 datasets.
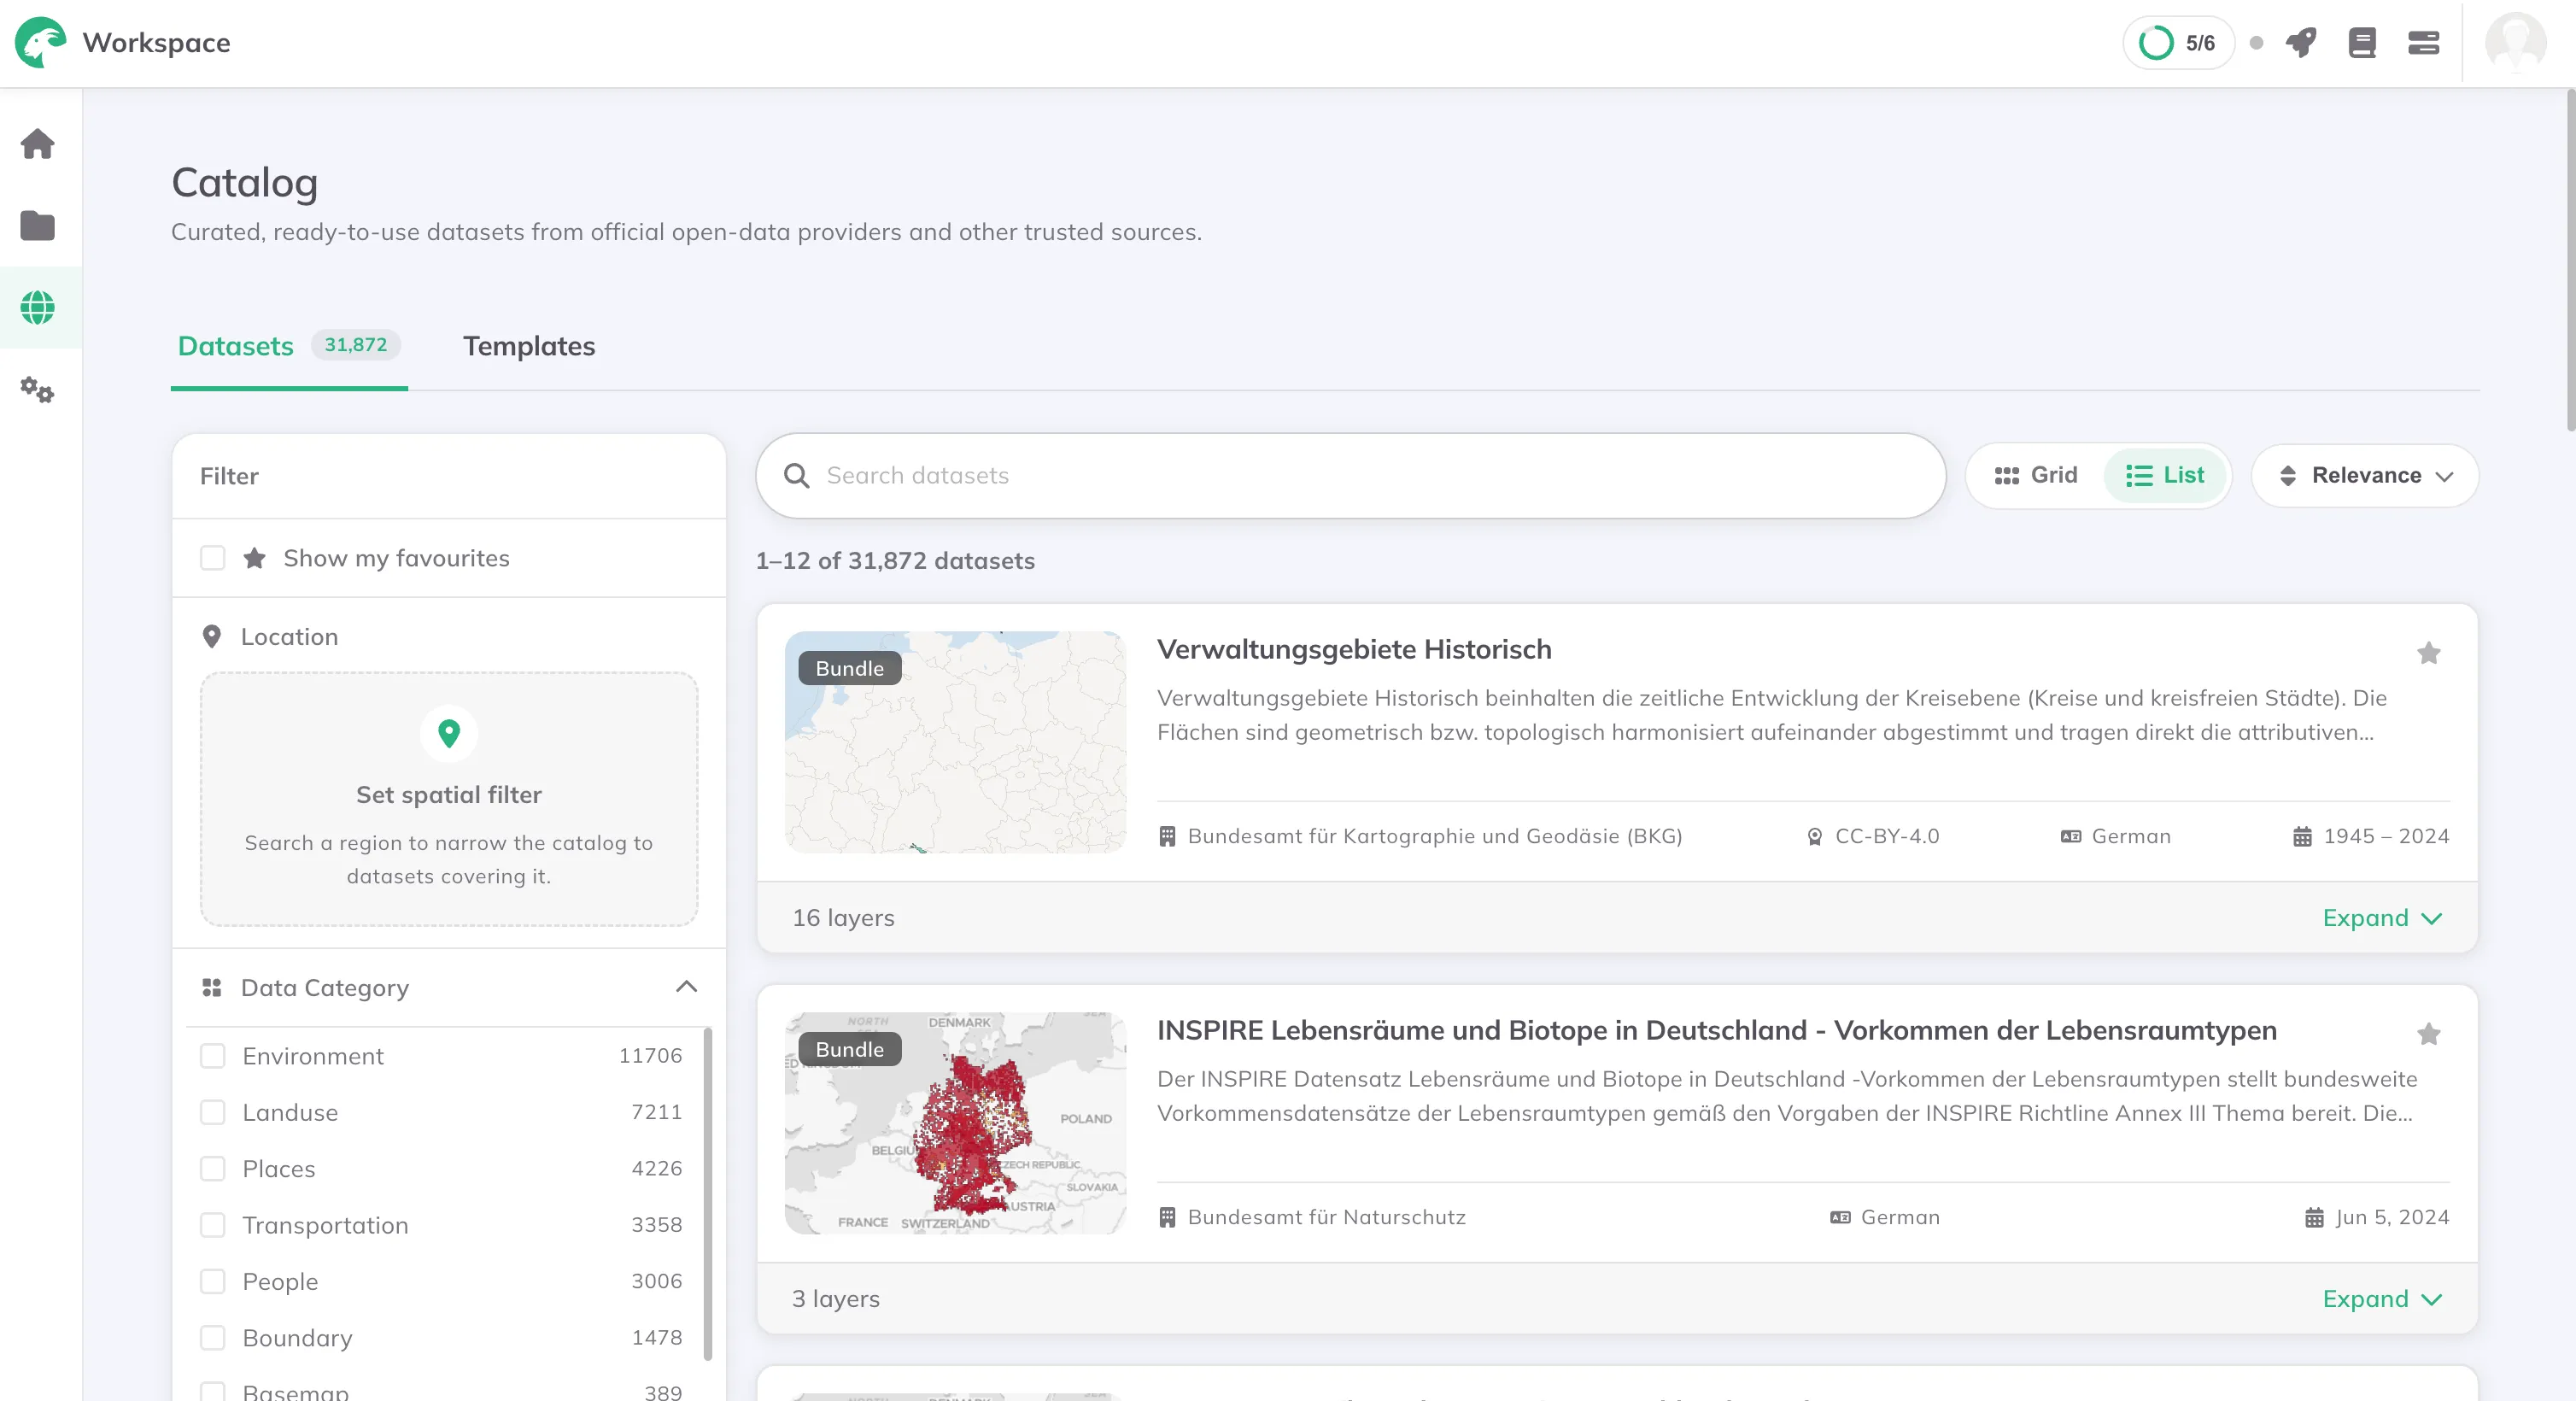
The Catalog: 31,872 datasets, filtered by location, category and data type.
That number is only possible because the datasets are no longer added one at a time. We collect from public geodata catalogs instead: national open data portals across Europe, regional and municipal portals, Overture Maps and OpenStreetMap. Cyrine Kamoun, our data expert, has been working on which catalogs feed it.
The pipeline that reads those sources is built with AI, and that is what makes the scale possible. It matches records across portals, classifies them by topic and data type, and extracts the metadata that the source often describes loosely or not at all. The result is one index, so a dataset from a German state portal and a layer from Overture are described the same way and can be found the same way.
What changes in the app is the first step of a project. You search the Catalog, filter by area, by topic and by data type, and add the dataset to your project. No download, no reprojection, no cleaning.
Finding a land use dataset for Upper Bavaria in the Catalog, without leaving GOAT.
2. Templates: three kinds
An empty map is a bad place to start, especially in your first hour with a new tool. v3 adds templates at three levels.
Project templates. Open a prepared project and look around it. The layers are styled, the analyses have been run, and the Dashboard is already built, so you can see how the results are meant to be read as well as how they were produced. It is the fastest way to understand what GOAT does before you have your own data in it.
Workflow templates. A prepared analysis, built as a Workflow, where the only thing missing is your data. If you want to calculate ÖV-Güteklassen for your region, you do not build the chain of steps yourself. The template already holds the indicator, and you connect your own transit data to it.
Layout templates. Prepared print Layouts you can use in your own project, so a print-ready map does not need to be designed from scratch.
And a smaller change that makes all three more useful: from inside a project you can now add Workflows and Layouts directly, instead of treating them as separate places.
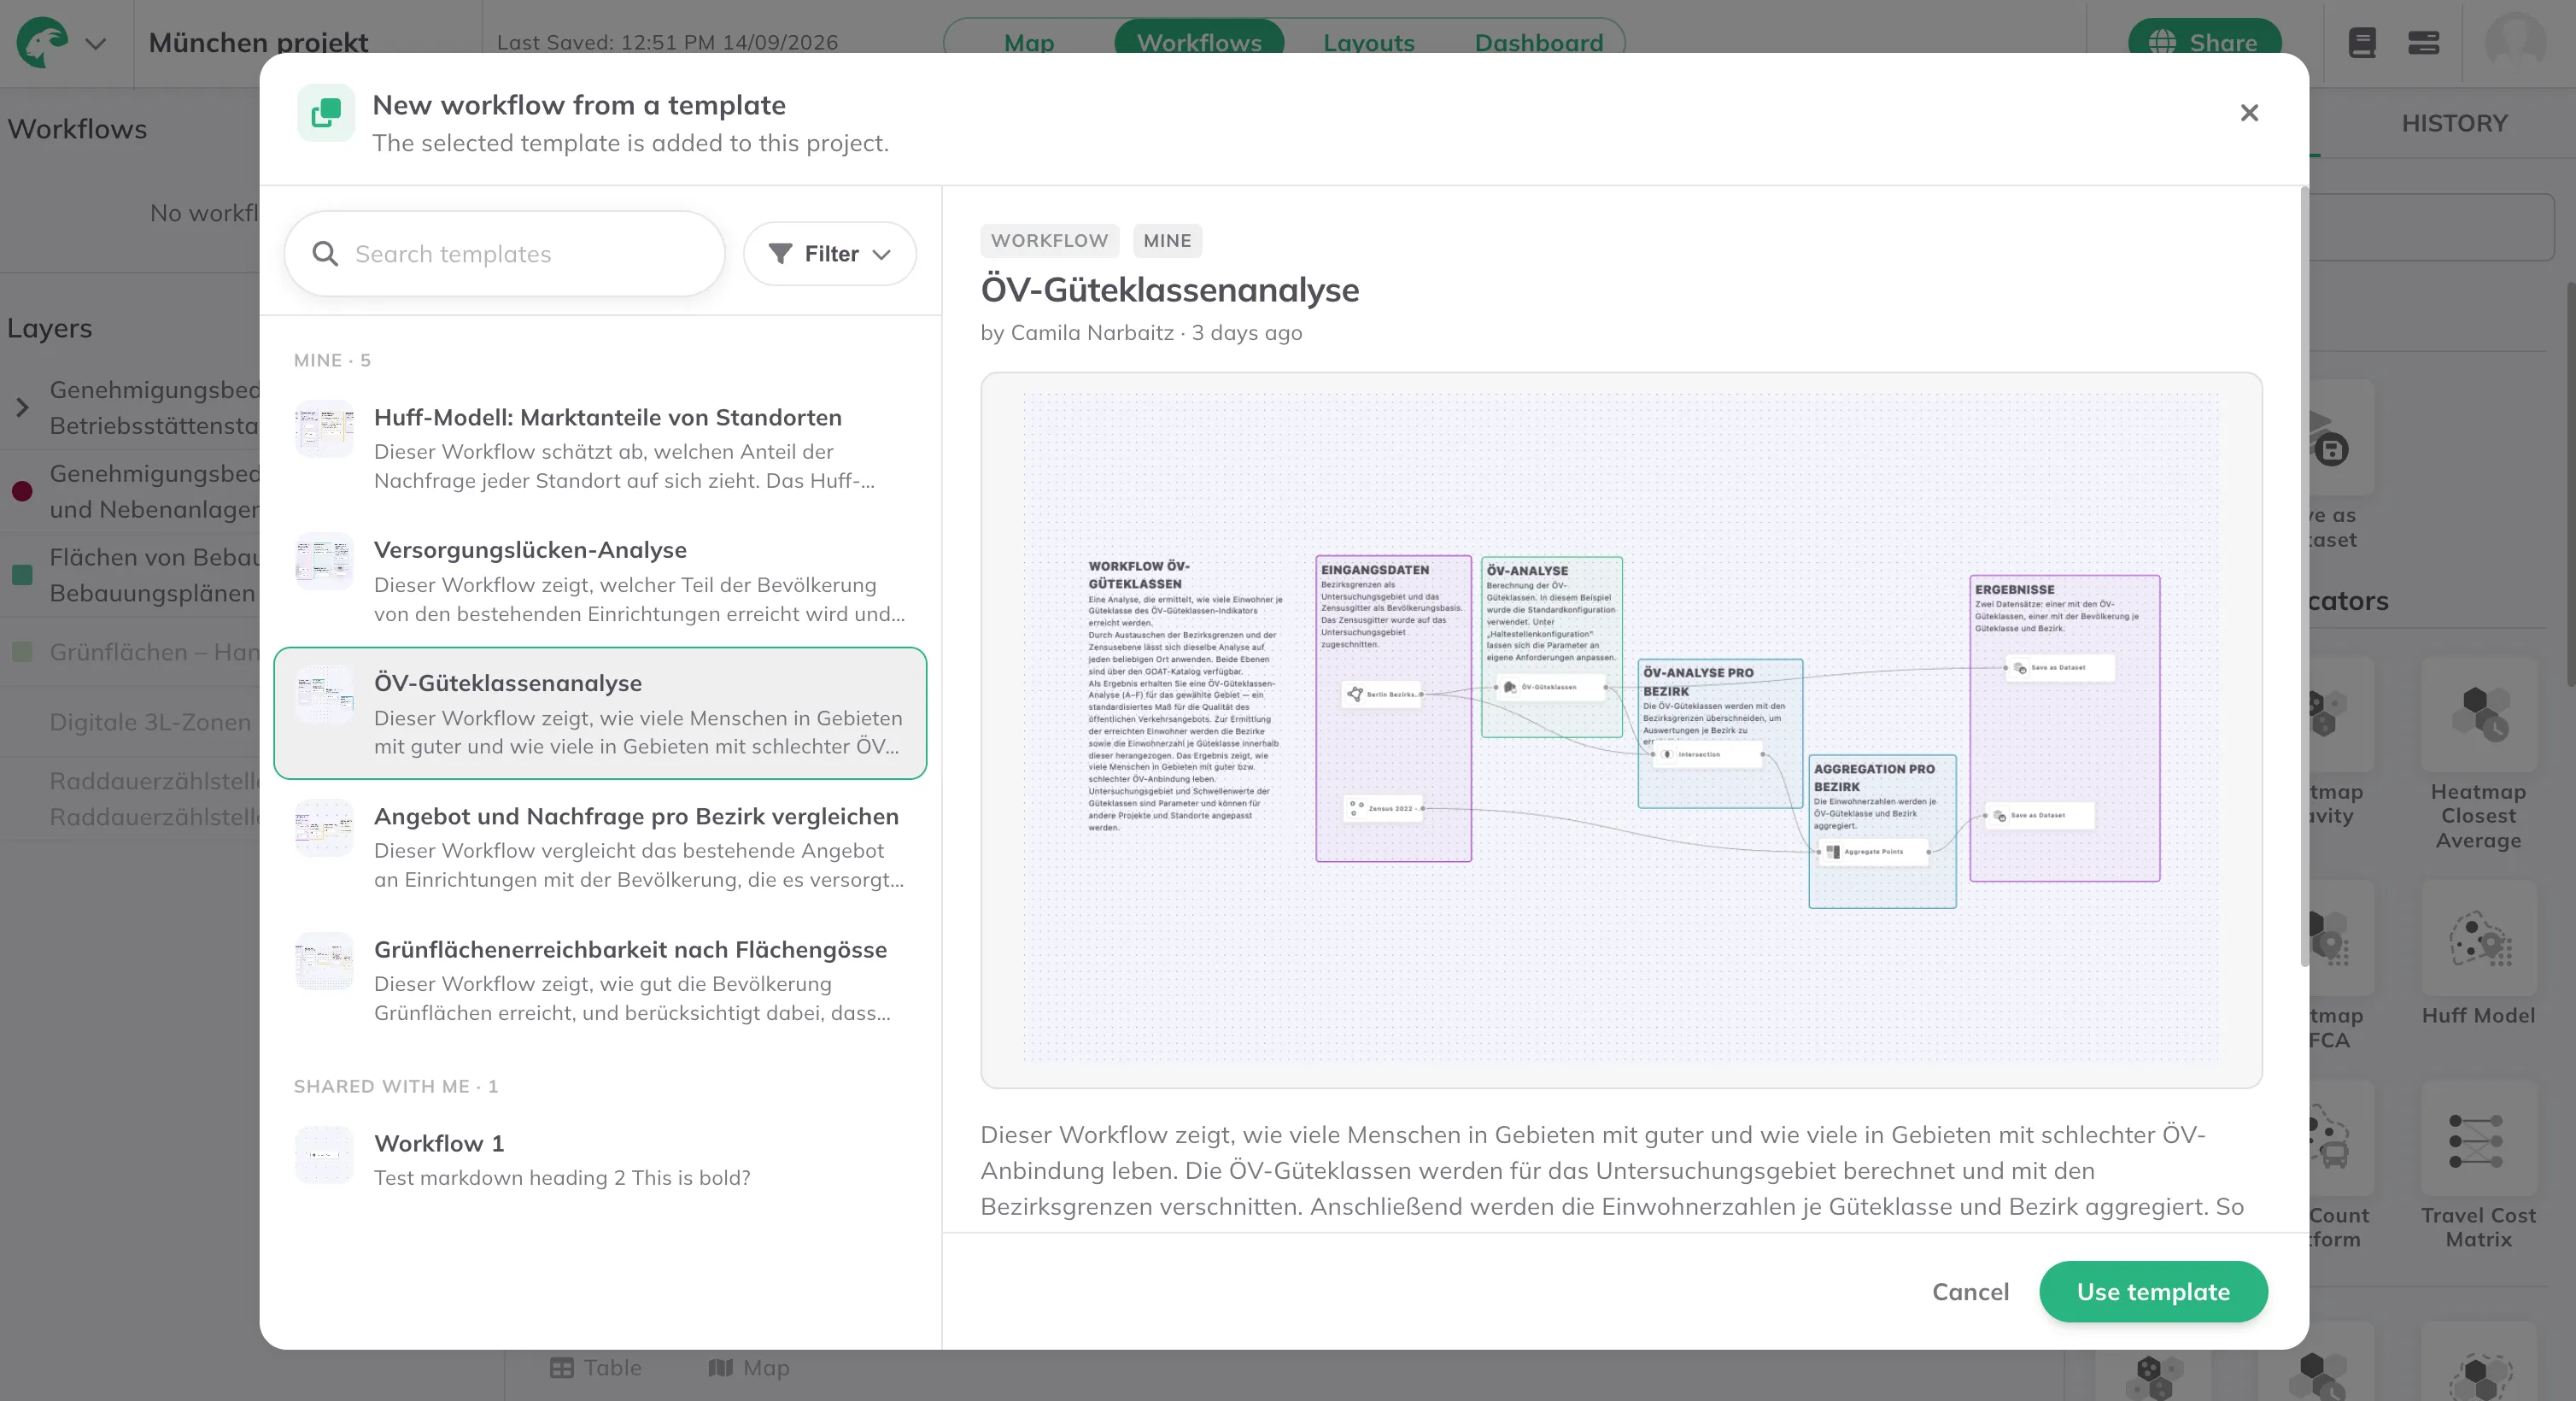
Workflows and Layouts now live inside the project.
3. Reworked content management
This is the change we thought about the longest. It is the least visible in a screenshot, and the one you feel the most while using GOAT.
Layers, datasets and projects are organised differently now, and the point of the rebuild was to make moving through them easy. You drag and drop to move things. Folders can sit inside folders. You can select several items at once and move or delete them together.
More importantly, everything is in one place. Projects, Templates, Datasets, Bundles and Folders all live in the same view, and you filter by type to see only what you want. That makes one question much easier to answer than it used to be: which data is connected to which project.
Sharing works across all of it now, not only on projects, and you can transfer ownership of an item to someone else. Useful when a colleague leaves, or when a project moves from the person who built it to the team that runs it.
The templates and this rebuild both came from Majk, our CTO, who has wanted to take this apart for a long time.
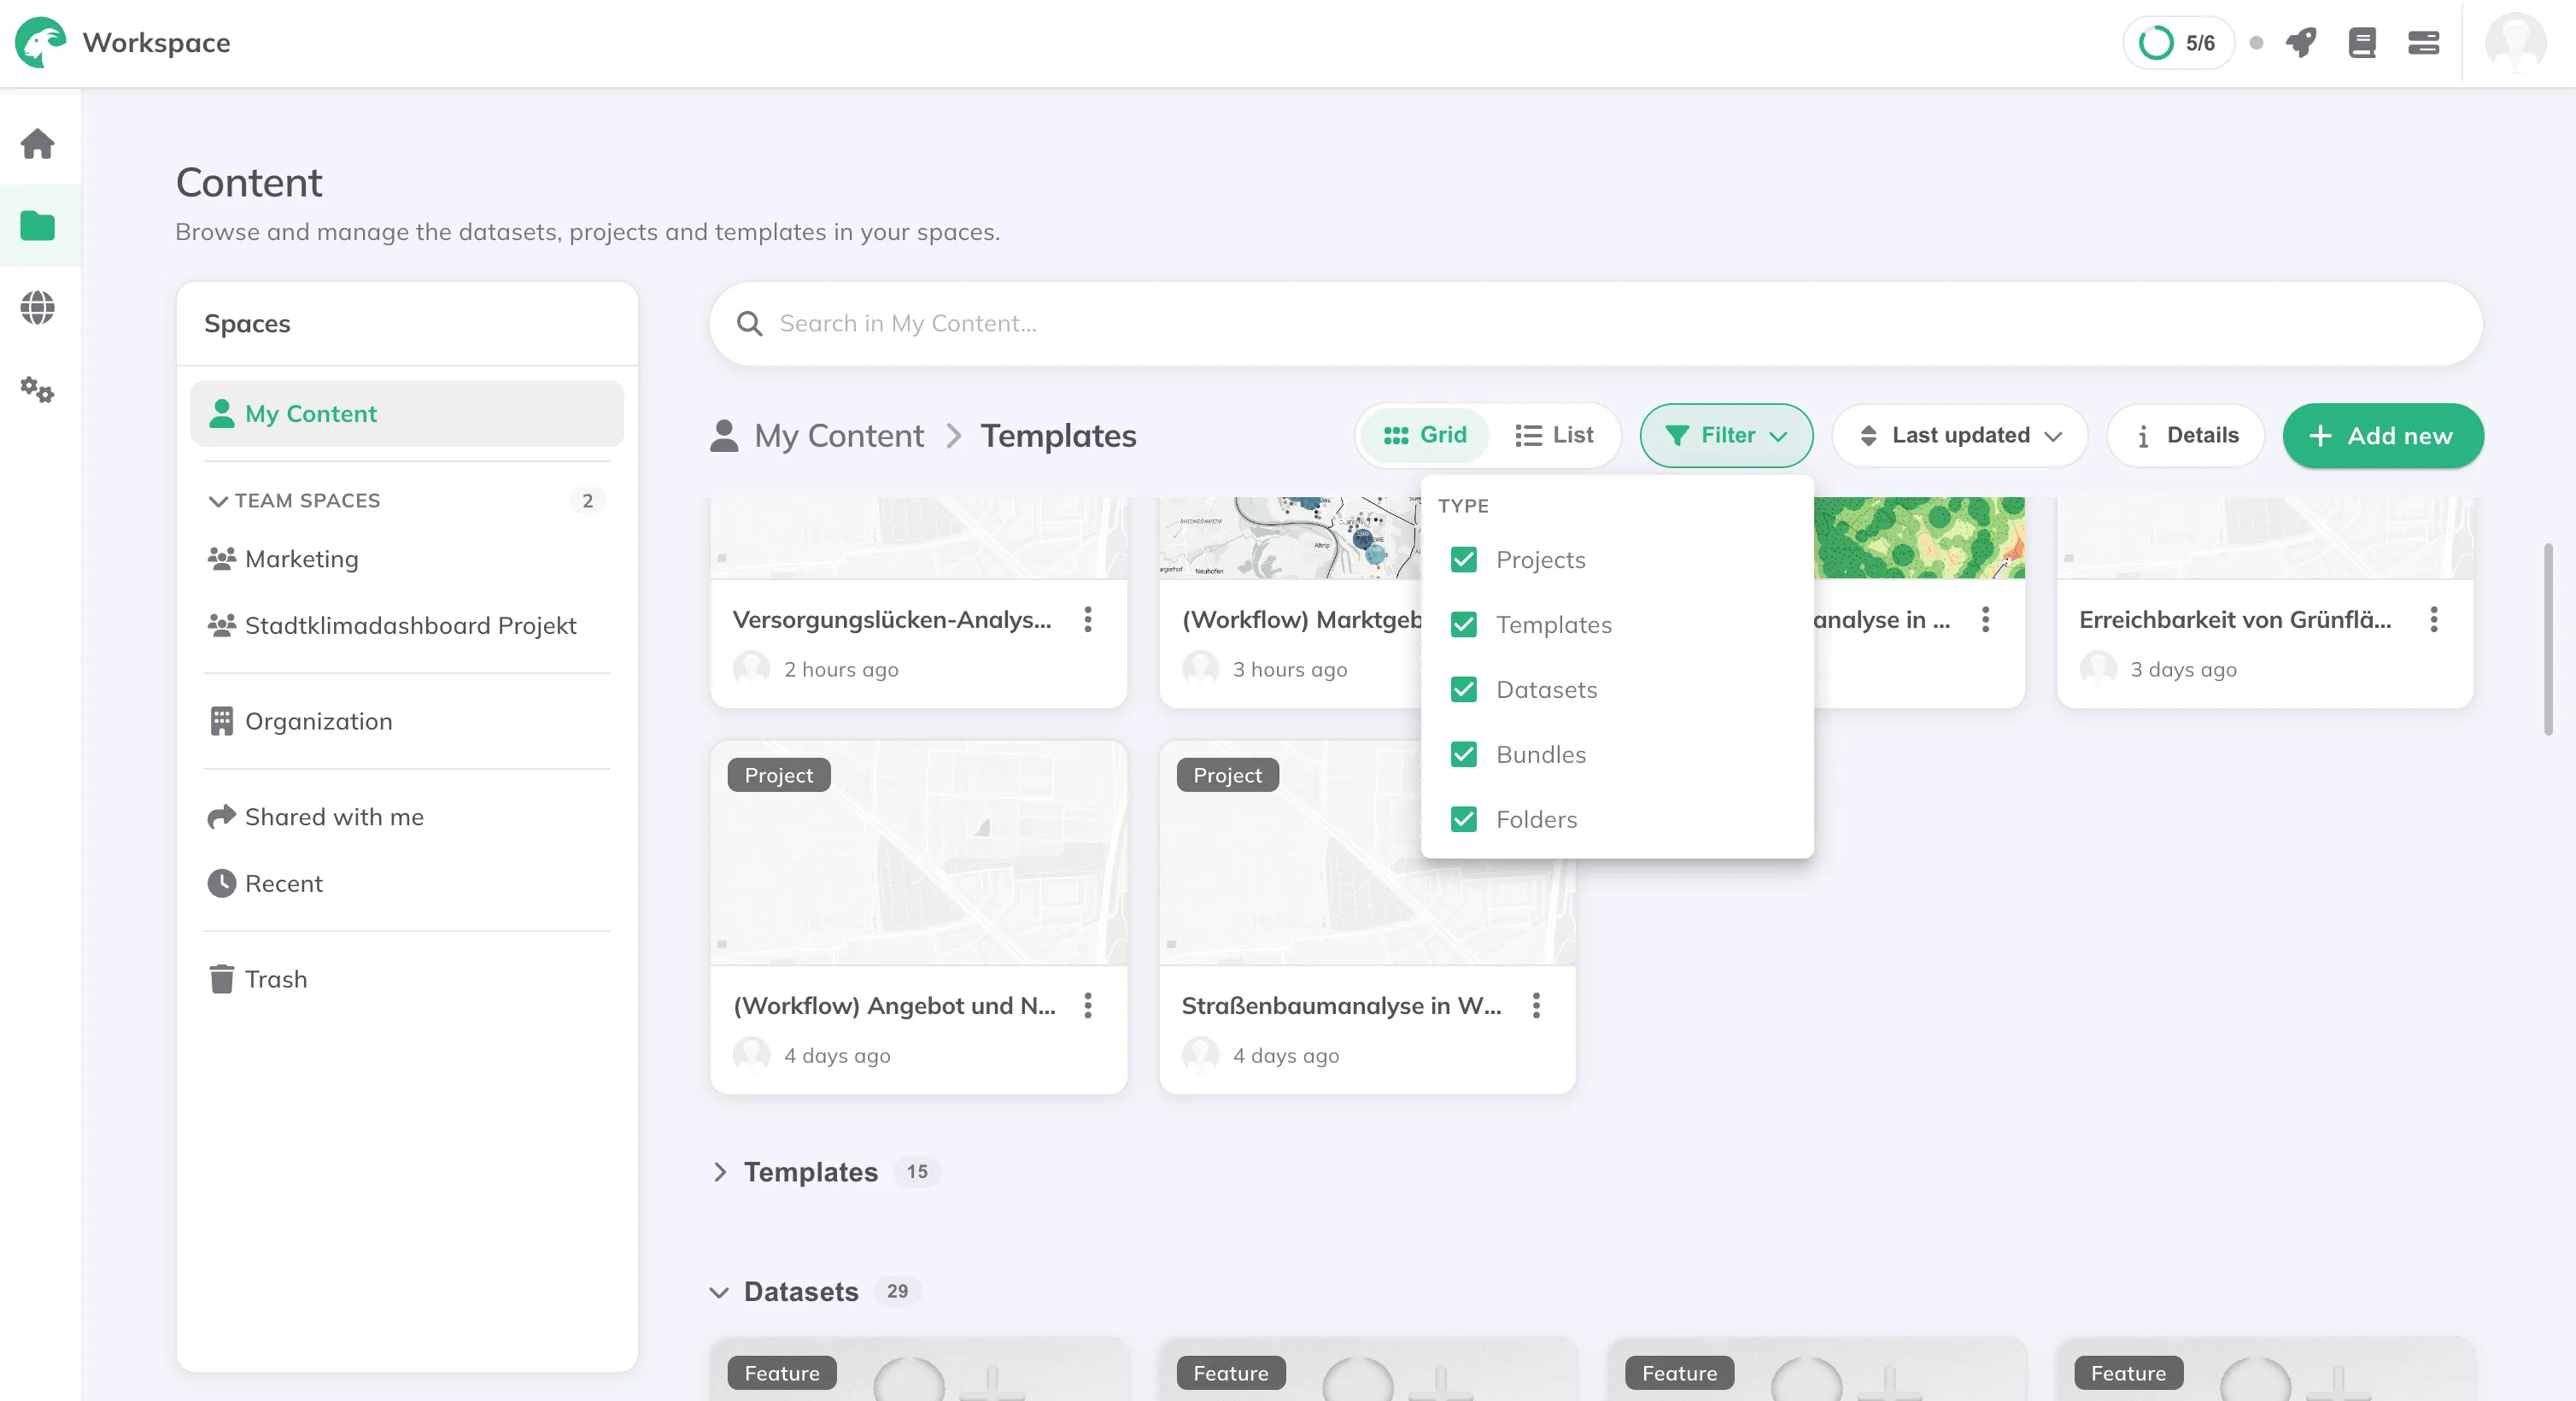
Projects, templates and datasets in one place.
4. Custom routing networks
Until now, accessibility analyses in GOAT ran on the routing networks we provide, which is also what set the limits of where GOAT could be used. In v3 you upload your own network and the analyses run on that instead.
Take Fukushima. We do not provide a routing network there, so until now the accessibility indicators had nothing to run on. Upload the street network for Fukushima and a Catchment Area works the same way it does in Munich. The same is true for public transport: bring the GTFS data for the region and the transit indicators run on it.
That opens two different situations. One is geographic, everywhere we do not already cover, which is most of the world. The other is local: a planned cycle network that does not exist yet, a site or campus network that is not in OpenStreetMap, or a national dataset a planning office trusts more than the open one.
The network has to arrive in the Overture format: a .zip file containing
segments.geoparquet and connectors.geoparquet. Nihar Thakkar, our routing expert,
built the upload for both the street network and the GTFS data.
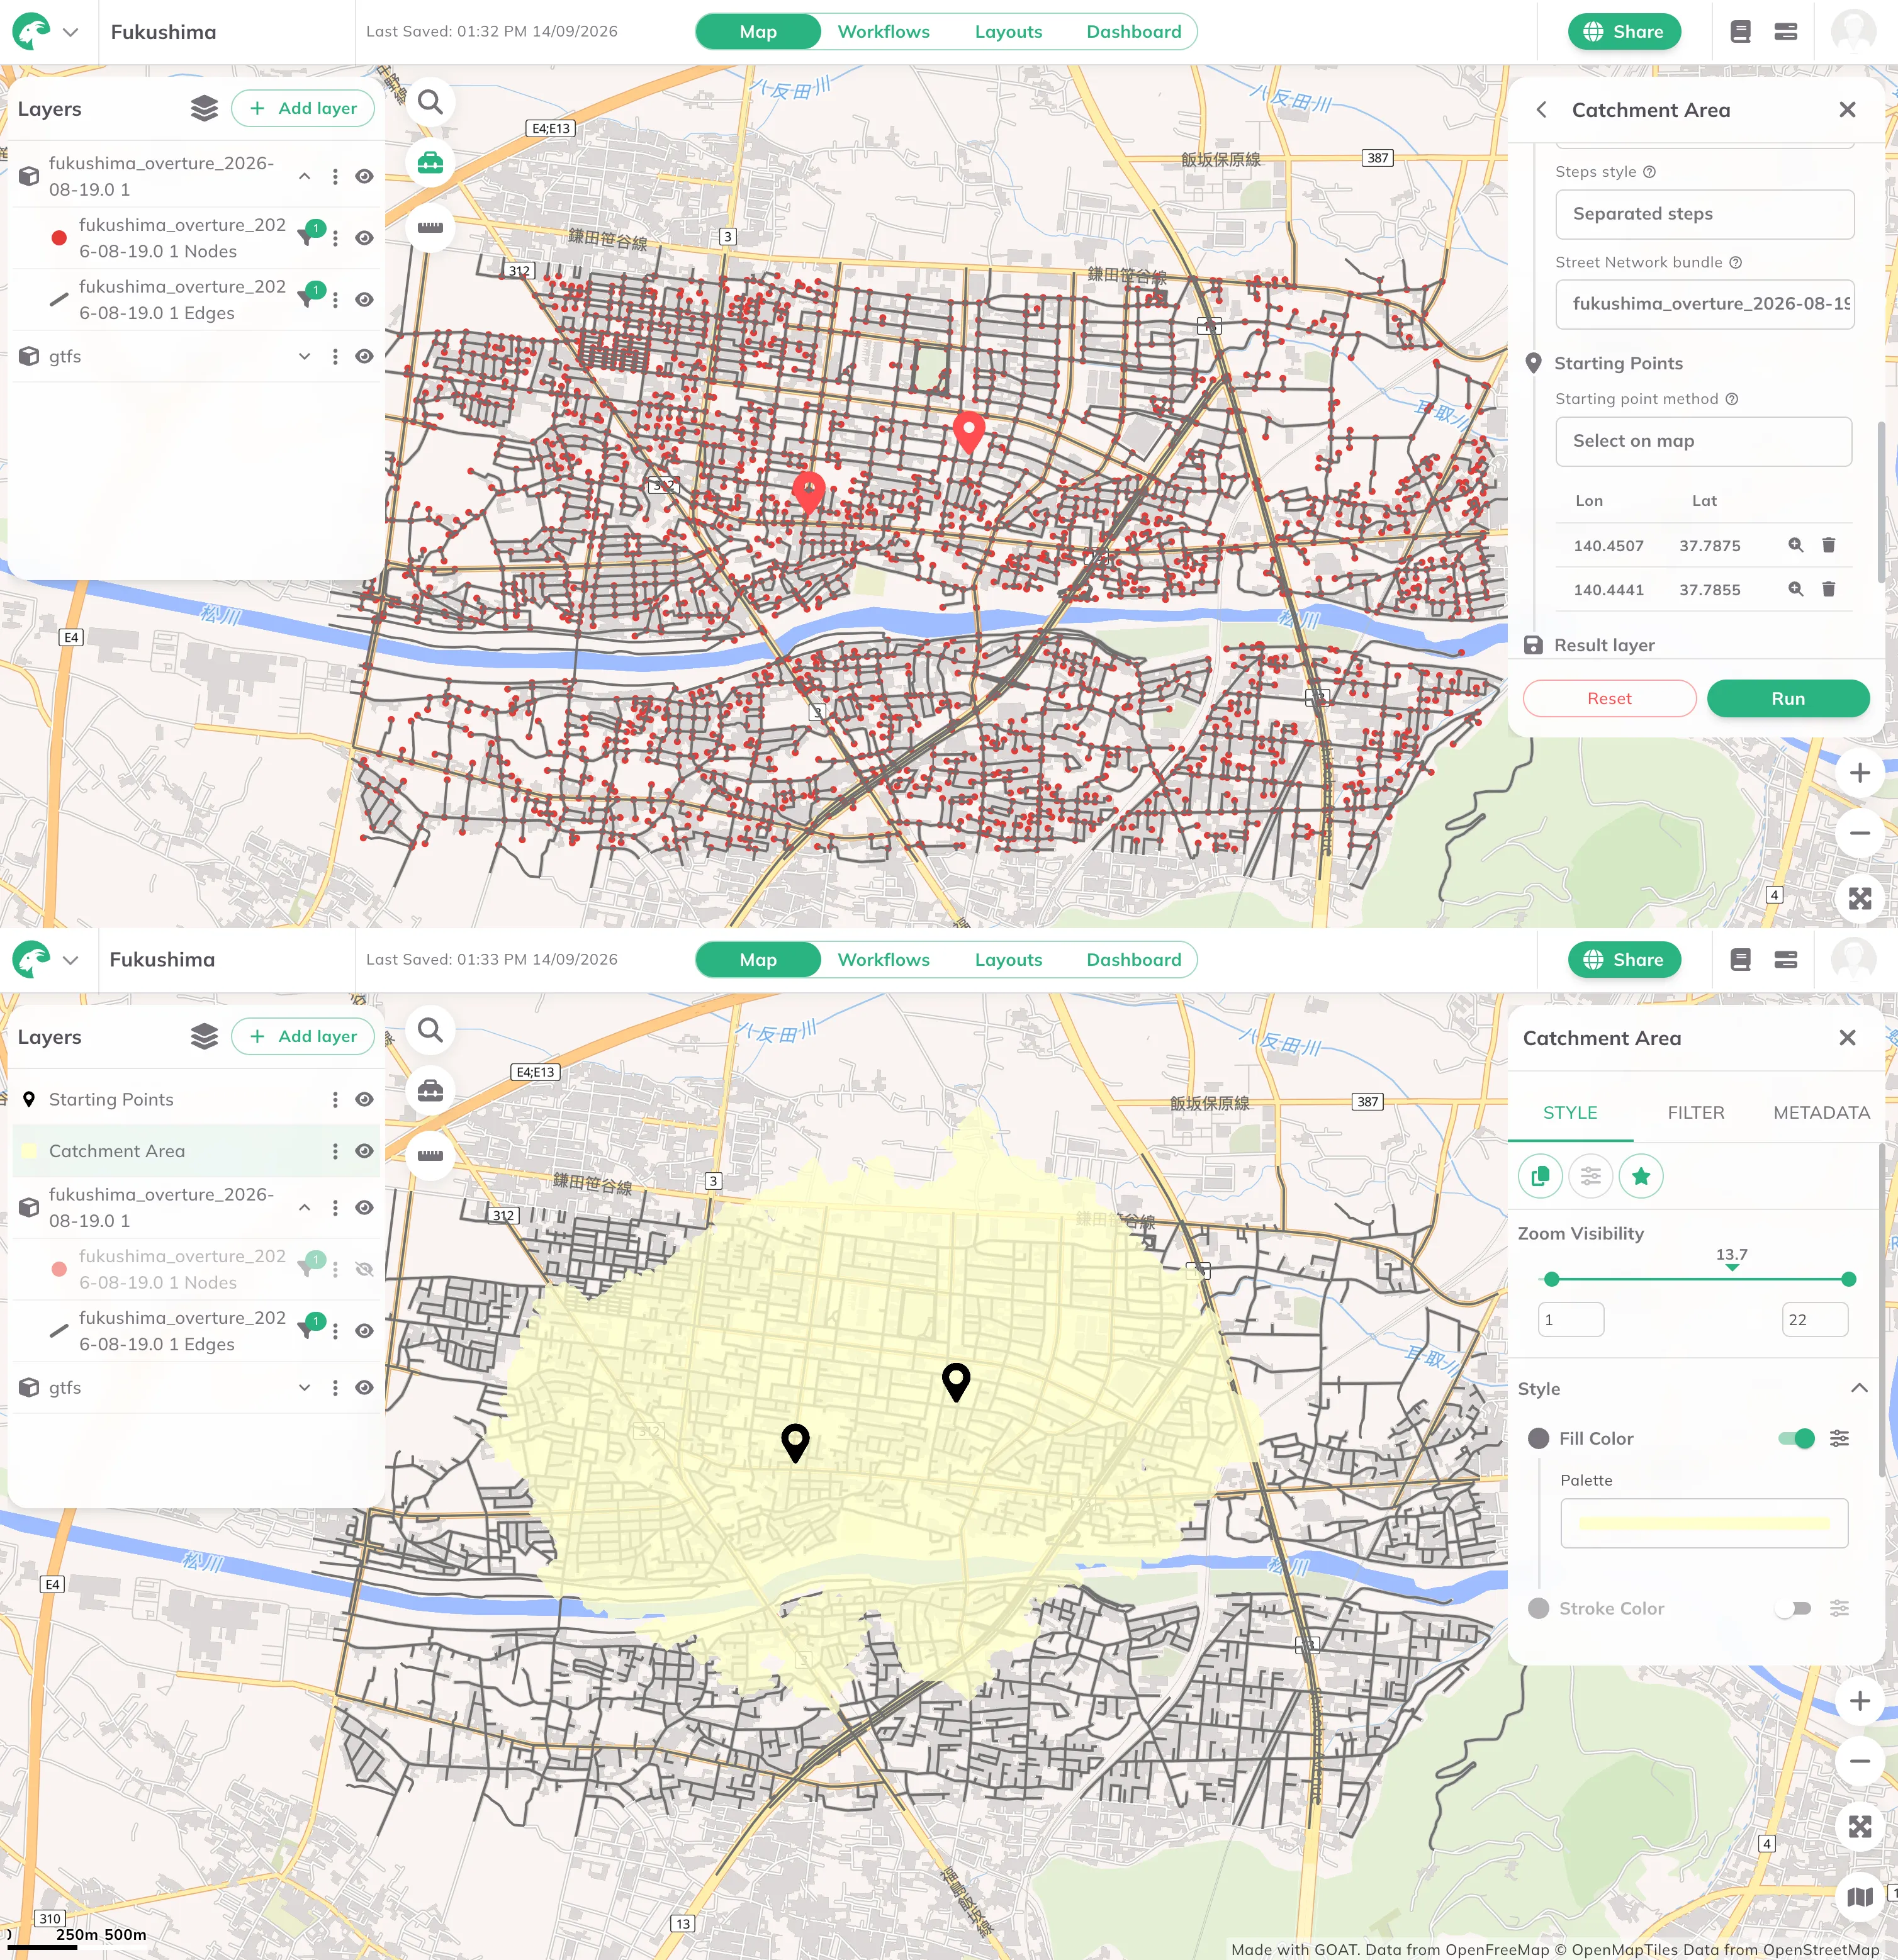
An uploaded street network for Fukushima, and a Catchment Area computed on it.
Why v3 matters for planning
The four changes are one change, seen from four sides. Before v3, the work before the analysis was most of the work: find the data, prepare it, set up the project, accept the network you were given.
v3 moves the starting line. The data is already there and searchable. The project starts from a setup somebody already built. The things you make are organised together and can be handed to a colleague. And if the network we provide is not the right one for your question, you use your own.
None of that makes the analysis itself easier. It makes the hour before the analysis shorter, which is where planning projects usually lose their time.
Two more of us shaped what you actually see. The UI/UX work, which is what makes the new features usable and not merely present, was mine. And Gokul Gopan tested them hard and wrote the documentation that goes with them.
Getting started
v3.0 is available now. If you already use GOAT, the Catalog, the templates and the new workspace are in the app. If you are not using it yet, GOAT is free to start.
Frequently asked questions
What is the GOAT data catalog?
The Catalog is Plan4Better's collection of ready to use geodata inside GOAT. In version 3.0 it holds more than 30,000 datasets, collected from national and regional open data portals across Europe, Overture Maps and OpenStreetMap, and indexed so they can be searched in one place. You add a dataset to a project directly, without downloading or preparing it yourself.
How do I find a dataset in GOAT?
Open the Catalog and filter by area, by topic or by data type. The results can be added straight to a project as a layer.
What is a project template in GOAT?
A project template is a prepared GOAT project with layers, analyses and a dashboard already set up. You open it and work in it instead of starting from an empty map. GOAT 3.0 also has Workflow templates, which hold a prepared analysis you connect your own data to, and Layout templates for printing.
Can I use my own routing network in GOAT?
Yes. From version 3.0 you can upload your own street network and run accessibility analyses on it, instead of only on the networks Plan4Better provides. The network has to be in the Overture format, a .zip file containing segments.geoparquet and connectors.geoparquet. For public transport, upload the GTFS data for the region. This means indicators such as Catchment Area work in places GOAT does not host a network for, anywhere in the world.
Is the data in the GOAT catalog free to use?
Yes. Every GOAT user has access to the whole Catalog and can use the datasets in their projects at no extra cost.
Do I need GIS skills to use GOAT 3.0?
No. The templates exist so that a project can start from a prepared setup, and the Catalog removes the data preparation step that usually needs GIS knowledge. Analyses are configured in the interface rather than written as code.
How do I upgrade to GOAT 3.0?
There is nothing to install. GOAT runs in the browser, so existing users see version 3.0 the next time they open the app.