July 14, 2026
GOAT
With GOAT 2.4.0 “Toggenburg”, we introduce visual analytical Workflows, powerful new spatial analysis tools, major dashboard improvements, and significant performance upgrades across the platform.
GOAT continues to evolve as an open, web-based WebGIS platform for spatial analysis, accessibility modeling, and data-driven urban planning. This release focuses on automation, advanced modeling capabilities, and scalable performance — enabling more complex and reproducible geospatial workflows.
GOAT 2.4.0 introduces:
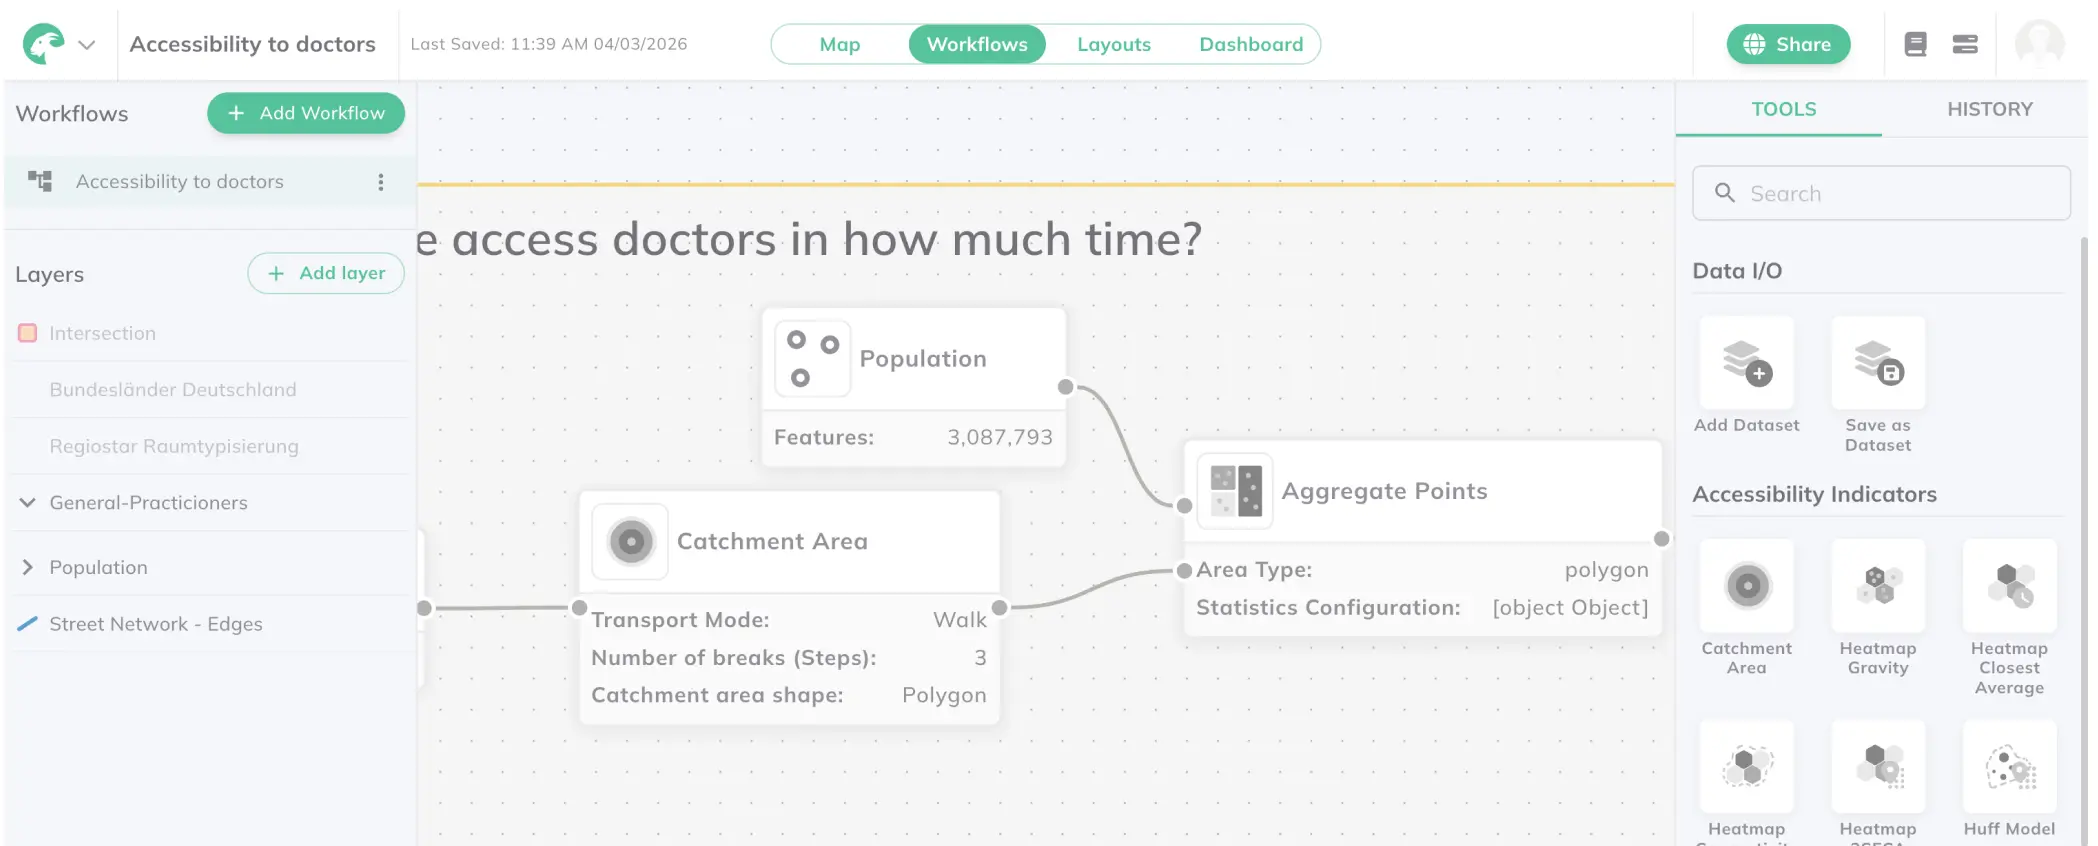
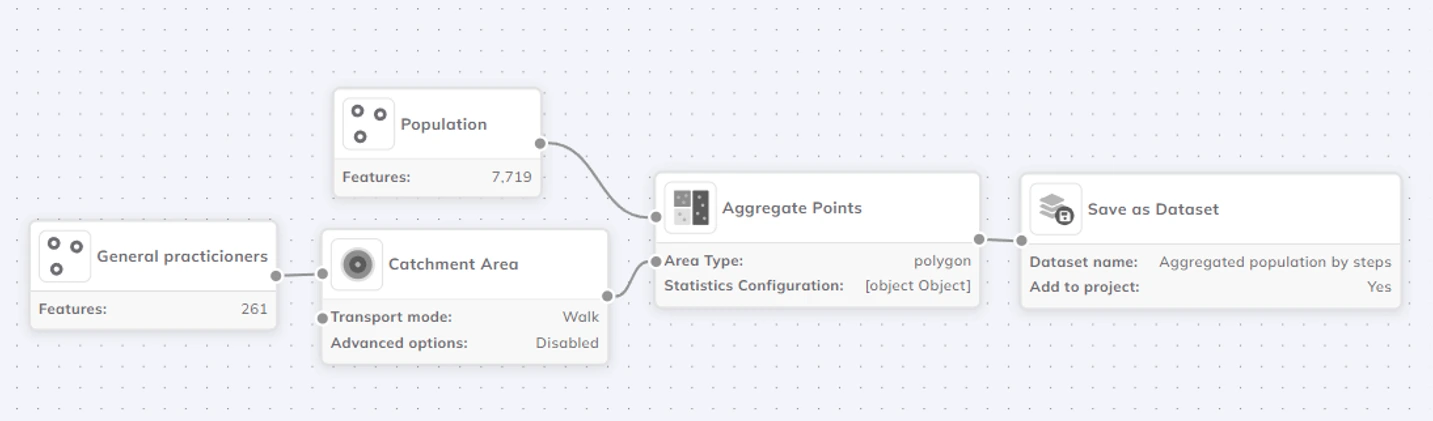
The highlight of GOAT 2.4.0 is the introduction of Workflows, a visual automation system for building multi-step analytical pipelines directly inside GOAT.
Using a visual canvas, complex spatial analysis processes can now be created by chaining together: Datasets, analytical tools, custom SQL transformations, export nodes. Each workflow is represented as a visual graph, making analytical logic transparent, structured, and reusable. This significantly improves reproducibility and automation in spatial data analysis.
Workflows support runtime variables, allowing parameters to be defined once and adjusted at execution time. This makes workflows reusable across: Different study areas, different datasets, different time thresholds or modeling parameters. Instead of repeating manual configuring steps, planners and researchers can now build scalable analytical templates.
Saved workflows can be executed directly from the Toolbox in Map Mode via the new Workflows tab. Execution tracking ensures full transparency across multi-step processes — especially valuable for large-scale spatial modeling and professional planning projects.
GOAT 2.4.0 expands its analytical depth with four new tools designed for advanced spatial modeling and planning analytics.
The Two-Step Floating Catchment Area (2SFCA) method is a widely used accessibility indicator that evaluates access to services by combining:
This approach provides a more realistic measurement of accessibility compared to simple distance-based methods and is especially relevant for: Healthcare accessibility analysis, school and childcare planning, public service evaluation, among many others.
The Huff Model is a probabilistic spatial interaction model that estimates the likelihood of users choosing a facility based on:
This model is commonly applied in: Retail analysis, facility location planning, competitive service analysis, among others. With the Huff Model integrated into GOAT, advanced spatial interaction modeling is now available directly in the WebGIS environment.
The new Spatial Clustering tool identifies clusters in point datasets using:
Configurable distance thresholds and growth parameters allow flexible analysis depending on research or planning goals. This is particularly useful for: Identifying activity hotspots, detecting spatial concentration patterns, mobility and demand analysis, among others.
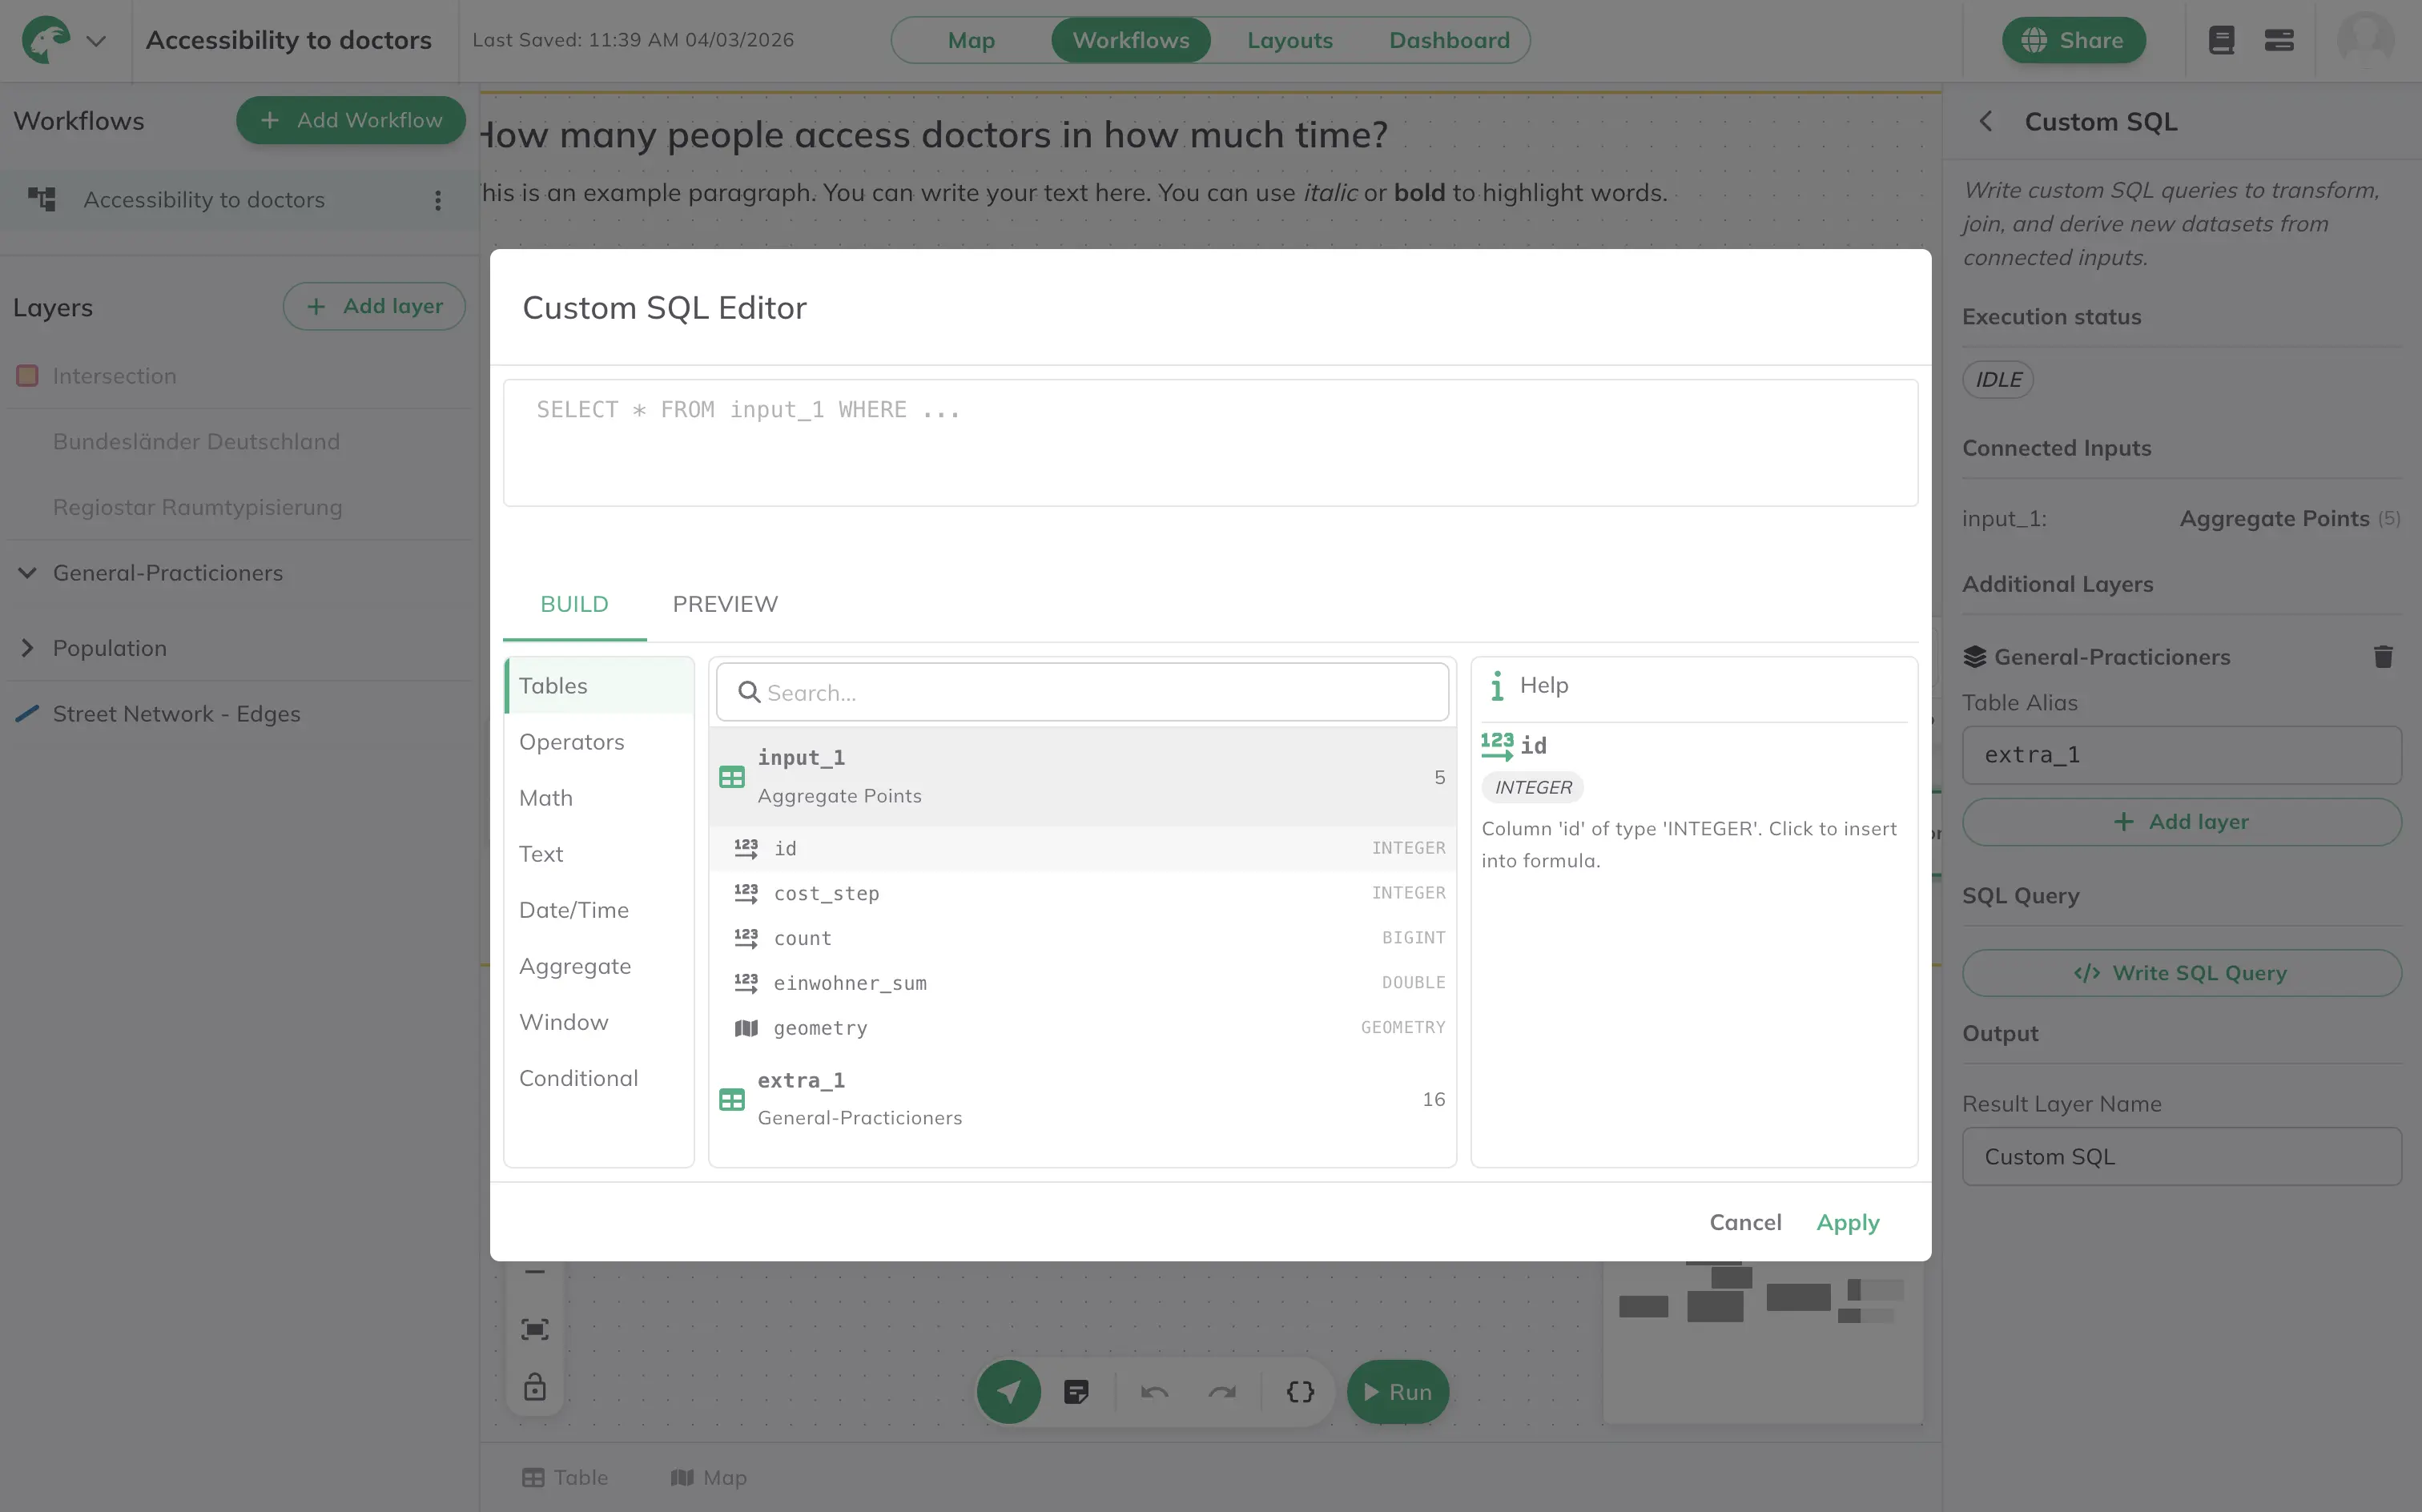
GOAT now includes a powerful Custom SQL tool with an integrated CodeMirror editor. Custom SQL can be used both as a standalone analysis tool and inside Workflows, enabling advanced geospatial data transformations directly within GOAT.
Features include: Syntax highlighting, autocomplete, schema prediction, query validation.
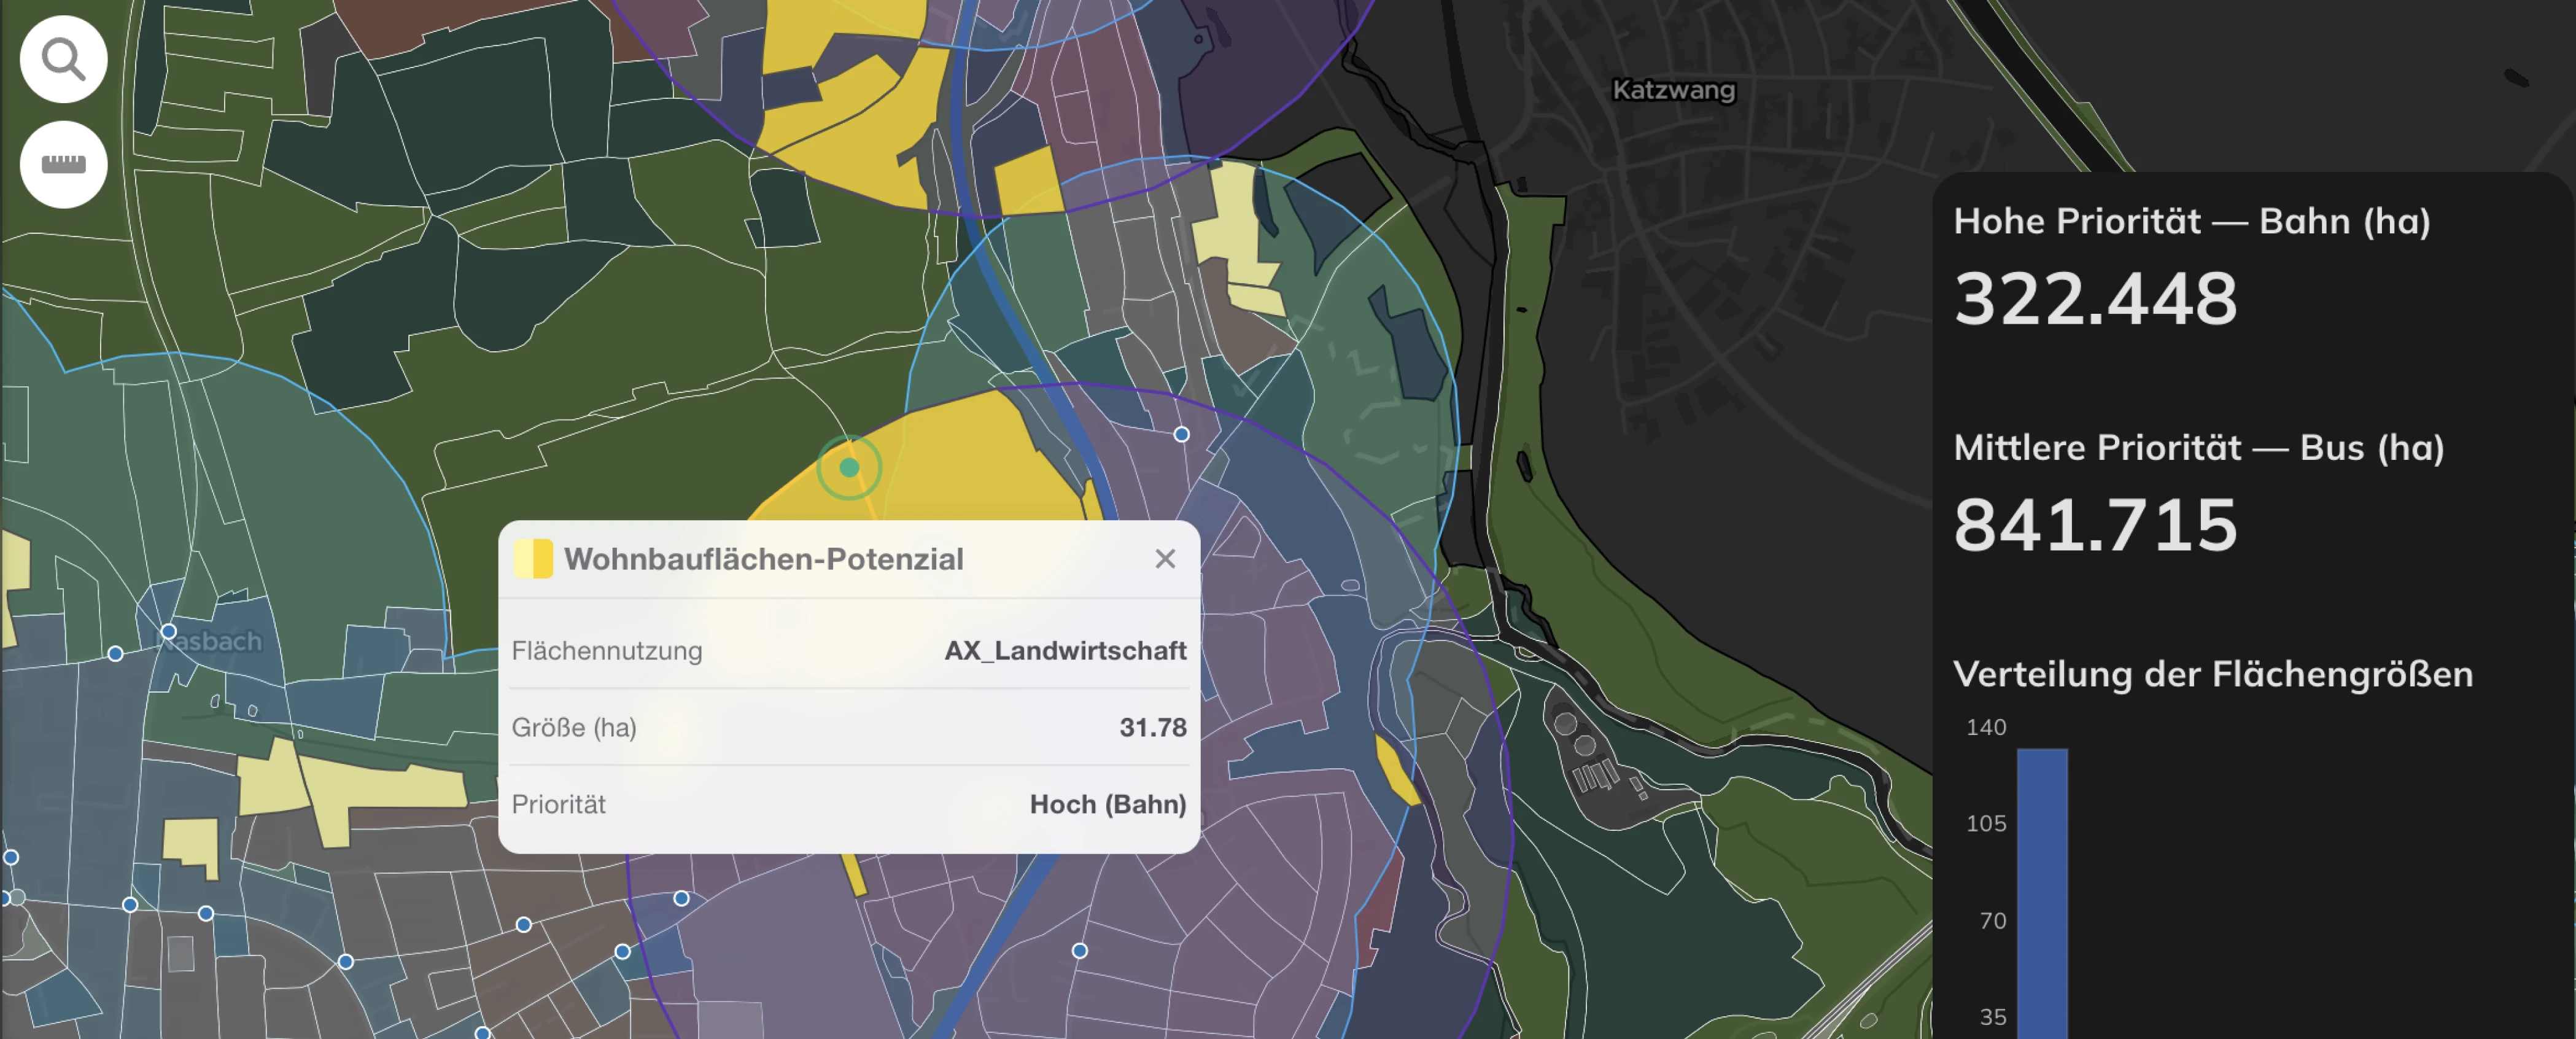
GOAT 2.4.0 significantly improves its dashboard and reporting capabilities.
New features include:
These improvements make GOAT dashboards more interactive, flexible, and suitable for professional reporting and stakeholder communication.
Report layouts can now be exported in JPEG format, in addition to existing export options. This adds flexibility for presentations, publications, and communication materials.
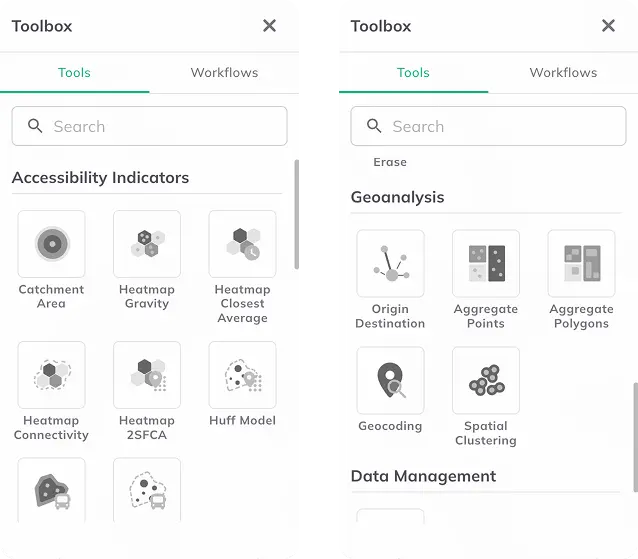
GOAT 2.4.0 also introduces several interface improvements.
The Toolbox now includes: A search bar for faster tool discovery and a tabbed interface separating Tools and Workflows This improves usability as the number of analytical features continues to grow.
Layer styling has been enhanced with: Better legend rendering, support for custom markers, improved handling of complex legends. This ensures more consistent visual output across maps, dashboards, and reports.
The new SQL editor provides: Syntax highlighting, keyword auto-capitalization, autocomplete. Making advanced spatial queries more accessible to analysts and researchers.
GOAT 2.4.0 introduces major architectural improvements to ensure high performance and scalability.
A new tile serving path based on PMTiles enables: Variable-depth over zoom, lazy loading, queue-based parallel tile generation. This results in significantly faster and more scalable vector tile delivery.
The OGC API Processes service has been separated from the GeoAPI. This prevents long-running analytical jobs from blocking tile or feature requests — improving system stability and responsiveness.
Running jobs can now be cancelled directly from the UI, giving users more control over computationally intensive analyses.
Further improvements include:
Together, these updates make GOAT noticeably faster and more scalable for large spatial datasets and complex analytical workflows.
GOAT 2.4.0 represents a major step toward:
By combining visual workflow automation with advanced analytical tools and backend performance improvements, GOAT strengthens its position as a comprehensive spatial analysis software and WebGIS platform for planning and research.
GOAT 2.4.0 is available now. Sign up for a free account to explore the new Workflows, advanced modeling tools, and performance improvements.
GOAT
.png)
Development

.jpg)
.jpg)
Join planners and cities already using GOAT to make better decisions, faster.