
Solutions
Calculate public transport quality classes
A circle around a bus stop tells you nothing about how often the bus comes. Public transport quality classes combine distance, frequency and mode into one class you can compare from place to place. We calculate them in GOAT, for single regions, whole states and all of Germany.
Covered is not the same as well served
Picture a village whose nearest bus stop is 300 metres away. The bus stops there twice a day. That village often counts as covered by public transport. For someone without a car who needs to get to work or to a doctor, it is not.
The reason is the measure. Most local transport plans in Germany draw a fixed radius around each stop. A radius says nothing about barriers on the way to the stop. It also says nothing about how often a bus or train actually calls there. The result is a map where almost everyone is covered and many people are still poorly connected.
The ÖV-Atlas by Agora Verkehrswende shows how big that gap is. Around 21 million people in Germany, about a quarter of the population, have poor public transport access or none at all. In cities above 100,000 residents, 77 per cent of people live in the two best classes. In municipalities below 1,000 residents, it is 1 per cent.
So transport authorities, transport associations and operators, municipalities, districts and the planning offices that work for them need a measure that rates distance and service together. With it, you can find underserved areas, for example for a local transport plan. You can show what a proposed service change does to access. And you can steer new development to places where the service already exists. In Switzerland, municipalities even use the classes to set how many parking spaces a building may have: better public transport means fewer spaces. Austria links its parking rules to public transport access in a similar way.
How public transport quality classes work
Public transport quality classes (ÖV-Güteklassen) come from Swiss planning practice. The Swiss Federal Office for Spatial Development (ARE) developed the method, the VSS standard SN 640 290 sets it out, and Austrian spatial planning uses it widely too. For a short definition, see our glossary. This page is about the calculation behind it.
It has two steps. First, every stop gets a category. The category depends on which mode serves the stop and how frequent the service is. Rail counts for more than tram, and tram for more than bus. The basis is the timetable of a typical weekday between 6 a.m. and 8 p.m.
Then the area around each stop gets a quality class. The closer a place is to a high-category stop, the better its class. A place that cannot reach a service at least every two hours within a reasonable distance gets no class at all.
Countries apply the framework in different ways. Switzerland uses four classes and measures distance as a buffer around the stop. Austria uses seven classes and measures distance along the real street network. For the ÖV-Atlas 2026, we calculated classes A to F.
It also matters what a class does not tell you. It describes the service where people live, not the journey they make. It says nothing about punctuality, crowding or travel time to a destination.
The full method, what the standard leaves open, and the results for Germany are in our whitepaper on public transport quality. You can download it further down this page.
Calculate public transport quality classes in GOAT
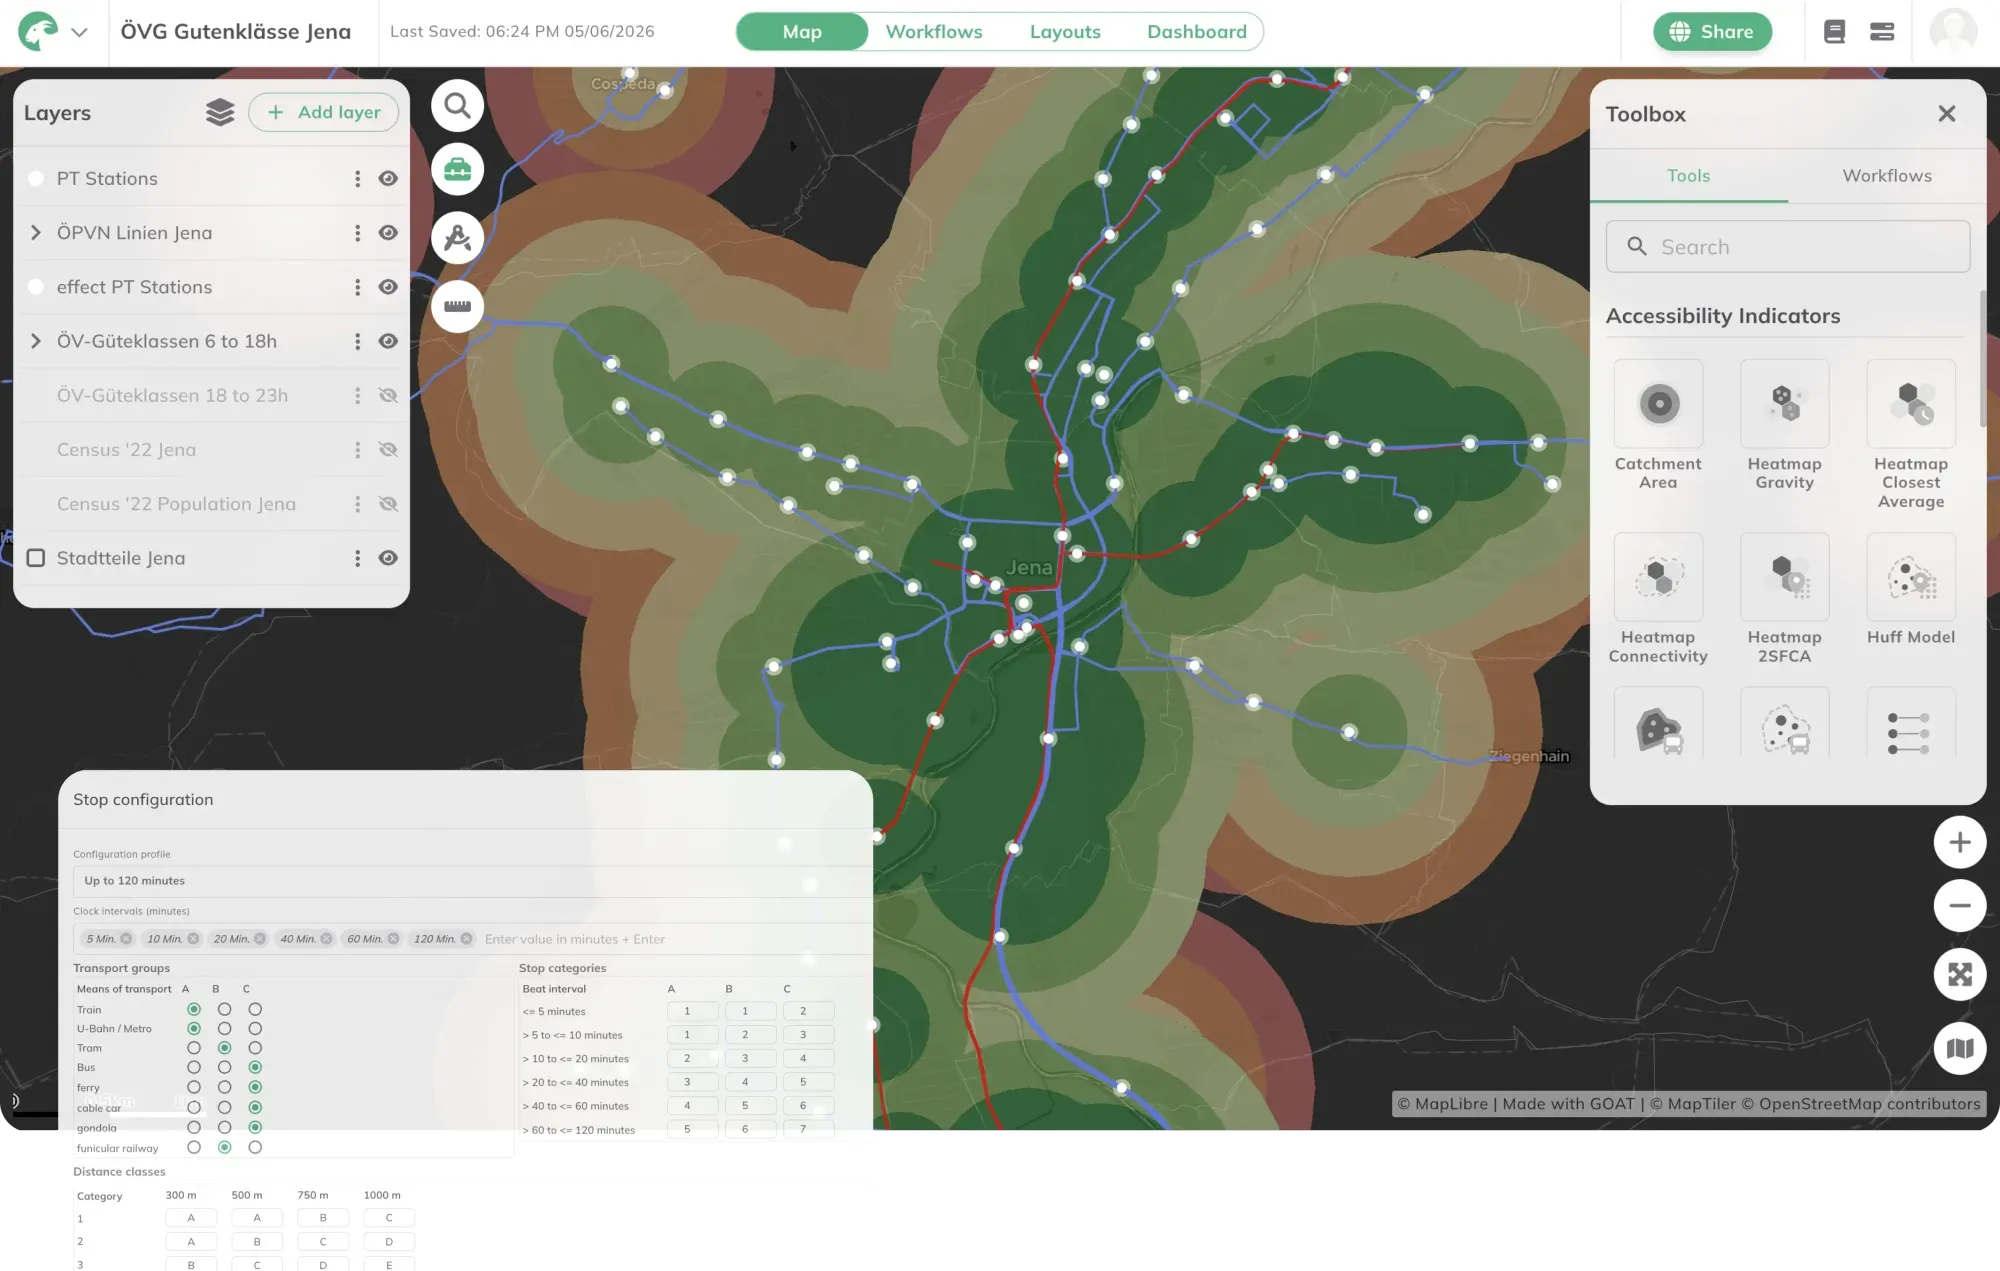
In GOAT, ÖV-Güteklassen is a tool of its own under Accessibility Indicators. You choose the day and the time window, for example a weekday from 6 a.m. to 8 p.m., or the evening hours. Each stop receives a category from I to VII, based on its mode and frequency. You measure distance either as a buffer or as an isochrone that follows the real street network, so detours and barriers that a radius ignores are taken into account. The GOAT documentation explains each setting.
The input is timetable data in GTFS format. Put the result on top of population data and you can see how many people live in each class, for every municipality and district.
We have done this at national scale. For Agora Verkehrswende, we calculated public transport quality classes for all of Germany, on the 100-metre grid of the 2022 census and with nationwide timetable data from DELFI. We used the most common daily service per line across 16 weeks, so that special services or holiday timetables do not distort the result. The outcome is one comparable figure for around 11,000 municipalities and 400 districts, which can be repeated every year for monitoring. With TU Wien and KCW, we calculated the classes for all of Austria. For NAH.SH in Schleswig-Holstein, we included on-demand services as well.
You can run the calculation yourself in GOAT, or ask us to do the analysis for your area. The projects are listed directly below.
From our projects
- Mobility Planning
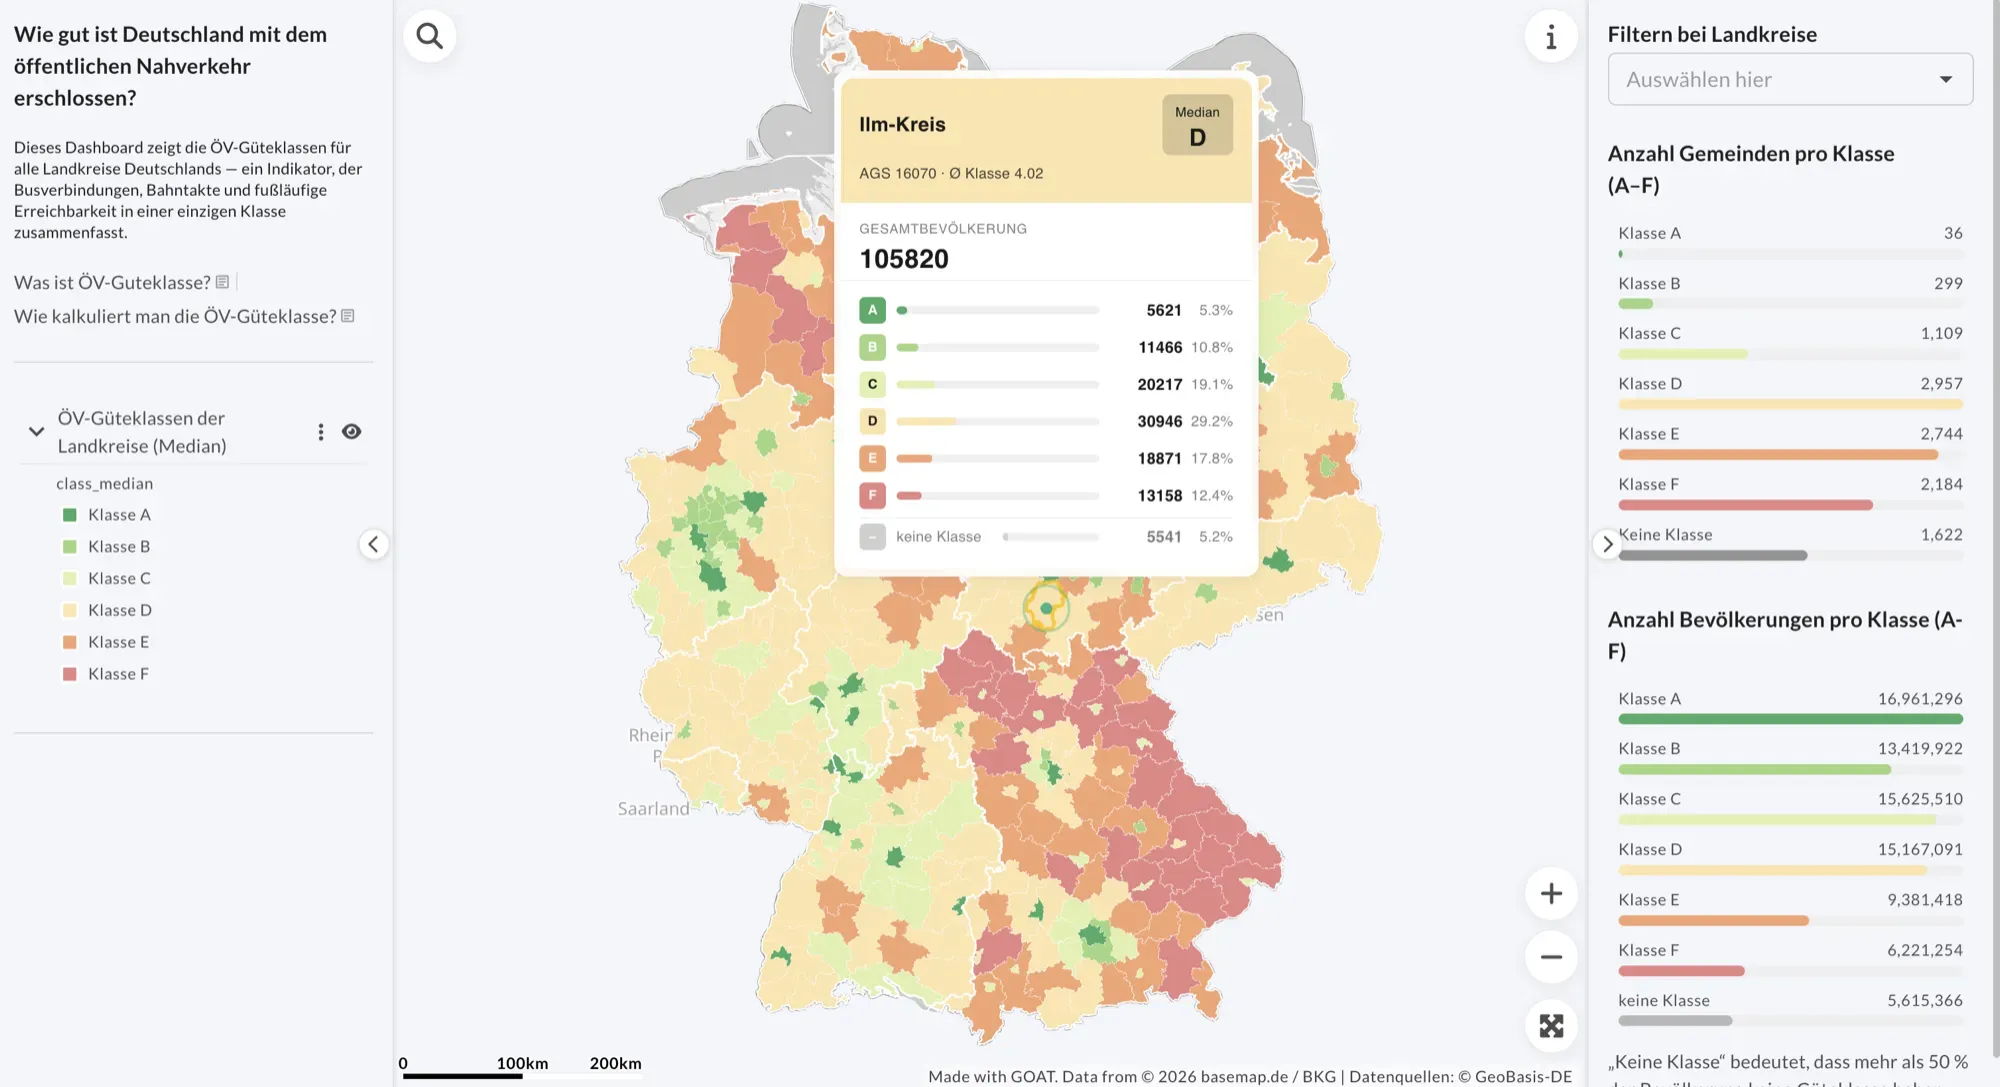
Public transport quality across Germany: the ÖV-Atlas 2026
For Agora Verkehrswende, we calculated public transport quality classes for the whole of Germany in GOAT, on the 100-metre population grid of the 2022 census.
Read the reference
- Mobility Planning
Calculation of public transport quality classes in Germany
In order to assess the quality of public transport services, public transport quality classes were calculated for a German federal state.
Read the reference
- Mobility Planning
Calculation of public transport quality classes in Austria
In cooperation with the Technical University of Vienna, the public transport quality classes were calculated for the entire country of Austria.
Read the reference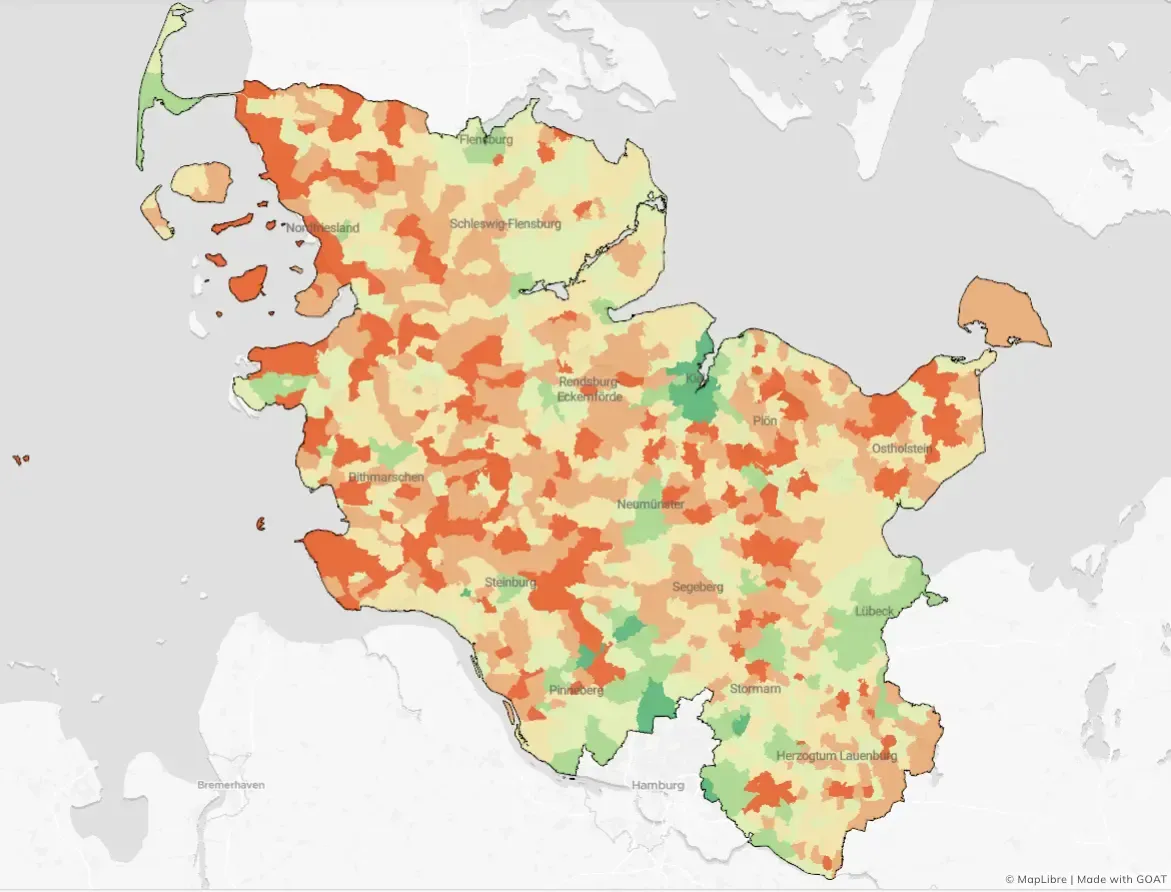
- Mobility Planning
Calculation of public transport quality in Schleswig-Holstein
For NAH.SH, we evaluated the quality of local public transport (ÖPNV) in Schleswig-Holstein, taking into account both traditional scheduled services and on-demand services.
Read the reference
Frequently asked questions
What are public transport quality classes?
A standardised rating of how well a place is served by public transport. It combines the distance to the nearest stops with how often services run there and which mode they are. Because the method is standardised, a class means the same thing in every region.
What data do you need to calculate public transport quality classes?
Mainly timetable data in GTFS format; for Germany, the nationwide feed from DELFI. To count how many people live in each class, you also need population data, such as the 100-metre grid of the 2022 German census, and administrative boundaries.
Can I calculate public transport quality classes myself in GOAT?
Yes. GOAT has a tool for it, called ÖV-Güteklassen in both languages. You choose the day and time window, and whether distance is measured as a buffer or as an isochrone along the street network.
How are quality classes different from a radius around the stop?
A fixed radius says nothing about barriers on the way to the stop, or about how often a bus or train calls there. Quality classes include frequency and mode. With isochrones, the distance also follows the real street network.
Can on-demand services be included in public transport quality classes?
Yes. For NAH.SH in Schleswig-Holstein, we assessed scheduled and on-demand services together in 2025, using timetable data, service hours and stops. Including on-demand services improved the measured accessibility there.
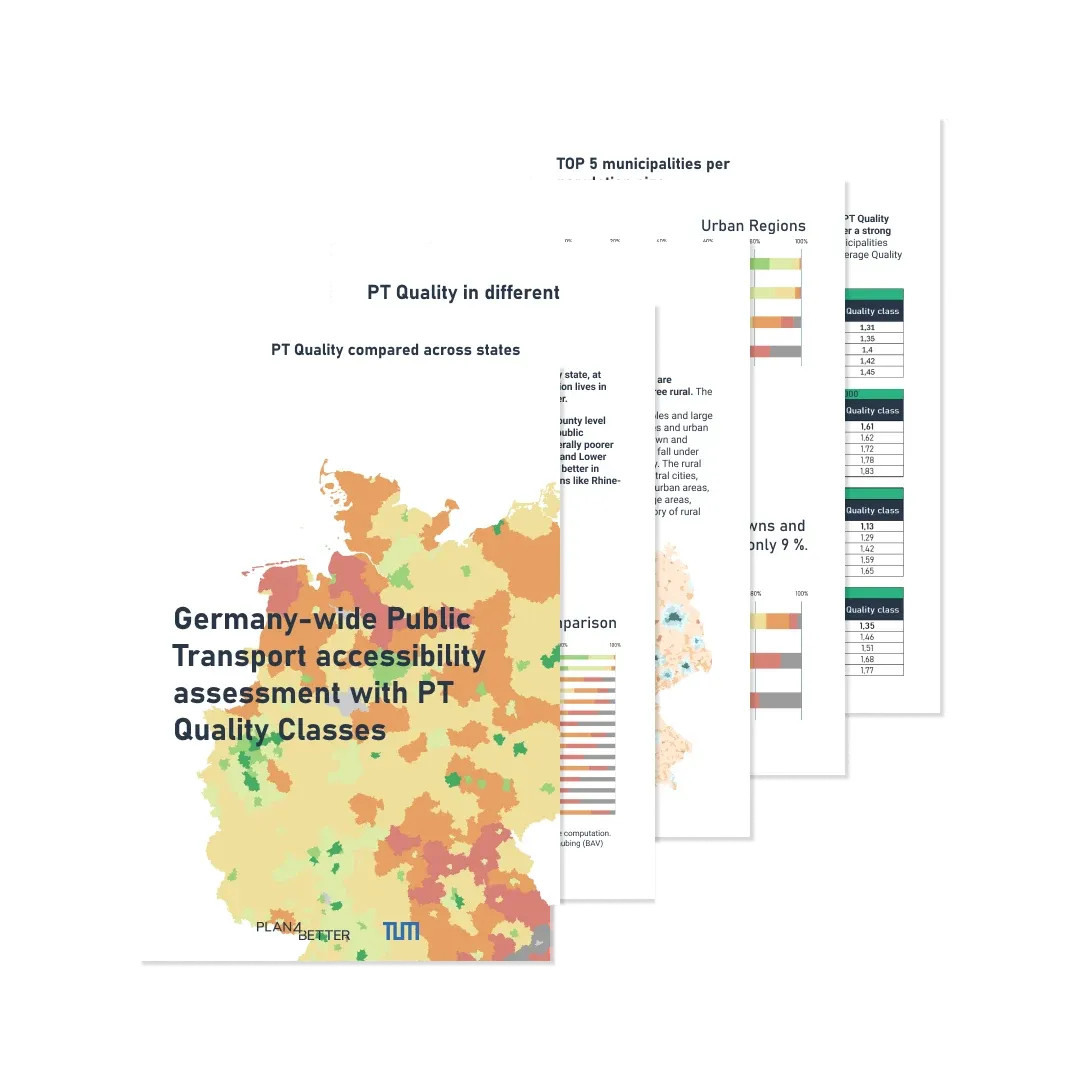
Public Transport Quality
ÖV-Güteklassen explained: how public transport quality classes are calculated, what the standard leaves out, and how to compute them for any area from timetable data.
Ready to make sense of your data?
Join planners, organizations and cities using GOAT to make better decisions, faster. No GIS expertise needed.