
Public transport quality across Germany: the ÖV-Atlas 2026
For Agora Verkehrswende, we calculated public transport quality classes for the whole of Germany in GOAT, on the 100-metre population grid of the 2022 census.
General information
- Client
- Agora Verkehrswende
- Period
- 2026
Planning cases
- Nationwide calculation of public transport quality classes on the 100-metre population grid
- Results at two levels: around 11,000 municipalities and 400 districts
- Processing of nationwide GTFS timetable data from DELFI into one comparable indicator
- Preparation of the results for open publication as a table and a GeoPackage
Overview
Agora Verkehrswende is a think tank working towards a climate-neutral transport sector, funded by Stiftung Mercator and the European Climate Foundation. Its ÖV-Atlas is an established publication that measures how well people in Germany are connected to public transport. For the 2026 edition, Agora Verkehrswende moved the atlas from its earlier trip-density measure to public transport quality classes, and commissioned Plan4Better to run the calculation.
What the indicator measures
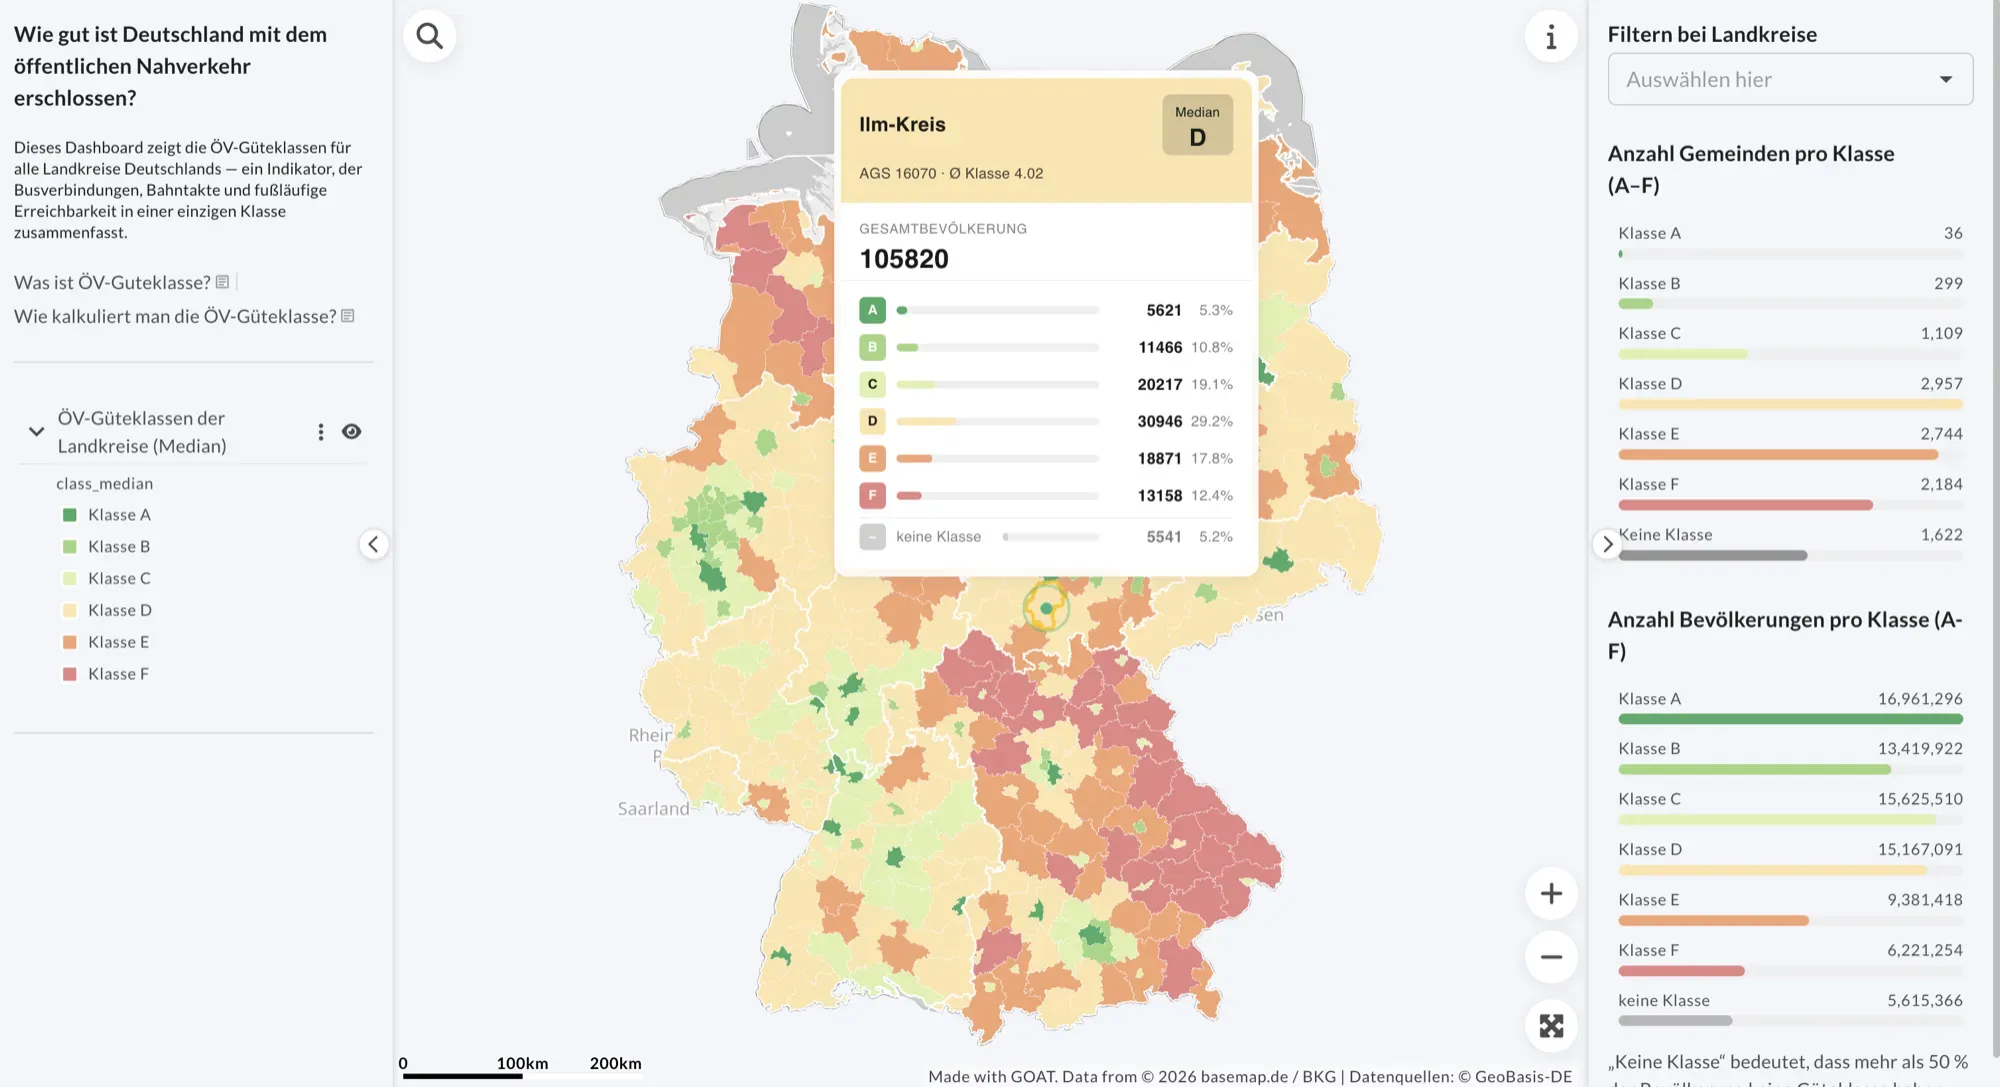
Every inhabited 100 by 100 metre cell in Germany receives a quality class from A to F. The class combines three things: how far the nearest stop is, how often a vehicle departs there, and which mode serves it, with rail weighted above tram and tram above bus. The method comes from the Swiss Federal Office for Spatial Development (ARE) and is set out in the VSS standard SN 640 290. A location that cannot reach a service at least every two hours within a reasonable distance receives no class at all.
The class describes the service at a place of residence, not the journey someone actually experiences. It says nothing about punctuality, occupancy or travel time to a destination.
The calculation
The analysis used nationwide scheduled timetable data from DELFI in GTFS format, with a timetable status of 31 January 2026, combined with the 100-metre population grid of the 2022 census and the official administrative boundaries of the Federal Agency for Cartography and Geodesy. For each stop, the average frequency on a typical weekday between 6 a.m. and 8 p.m. was determined and combined with the highest-value mode serving it. Rather than a single reference day, the analysis used the most common daily service per line across 16 weeks, so that individual special services or reduced holiday timetables do not distort the result.
The results were then aggregated to municipality and district level, weighted by population, so that two areas of different size and shape can be compared.
What came out
The atlas gives Agora Verkehrswende a comparable figure for every municipality and district in Germany. Among the findings it draws from the data: 21 million people, about a quarter of the population, live where public transport does not reach class D, which can be considered a good basic service outside the large cities. In cities above 100,000 residents, 77 per cent of people reach the two best classes, against 1 per cent in municipalities below 1,000.
Because the indicator is a single comparable value, it can be repeated year on year, which makes it usable for monitoring rather than only for a one-off picture.
Open data
Agora Verkehrswende publishes the results for free reuse under CC-BY 4.0, as an Excel table and as a GeoPackage, citing Agora Verkehrswende and Plan4Better as the source. The full publication is at ÖV-Atlas 2026.
Every district by its median class, and how its residents divide across the six Filtered to one district, the counts on the right narrow to its municipalities Close in, where the classes come from: the catchment around each stop and the census population inside it
If you liked this, take a look at

Accessibility analyses for projects "Mobilitätsgarantie" and "ÖV Atlas"
Various accessibility analyses of public transport services were carried out for Agora Verkehrswende using GOAT.
Read the referenceMeasuring accessibility across a whole region?
Book a slot and we will look at your study area and the data it needs.
Ready to make sense of your data?
Join planners, organizations and cities using GOAT to make better decisions, faster. No GIS expertise needed.