
Solutions
Municipal heat planning with GIS
A heat plan is built from data on every building: heat demand, energy source, building age, networks. In a GIS, that data becomes maps that show where district heating makes sense and where retrofits should come first. We have supported heat planning and energy district concepts in Mainburg, Amberg and Altrip, and delivered the results in each case as a WebGIS in GOAT.
A heat plan starts with each building
Germany’s Heat Planning Act (Wärmeplanungsgesetz, WPG) requires every municipality to plan its heat supply. Cities with more than 100,000 residents had to present their heat plan by mid-2026. All other municipalities have until mid-2028. The goal is a greenhouse gas neutral heat supply by 2045.
The question a heat plan has to answer is a spatial one. In which streets and districts does a district heating network make sense, and where will each building keep its own heating? The answer depends on data that, in most municipalities, sits in different places. Heat demand is in state studies or consumption records, energy sources are in the census, and the gas and heating networks are with the municipal utility. Building age and renovation status are often not recorded completely anywhere.
A GIS brings this data together on one map, for every building and every block. A dashboard for Rheinbach in our gallery shows what that looks like. It maps the heat demand of all 14,961 heated buildings, the streets and blocks where demand is highest, the main energy source per block, and the buildings where a retrofit would have the most effect. The data comes from the open Energieatlas NRW and the Wärmestudie NRW.
How heat planning works
It starts with a status analysis. In Mainburg, where we are preparing the heat plan with a partner, we brought together heat consumption density, the share of each energy source, building types, renovation status and the gas and district heating networks. Energy sources come from the 2022 census. A digital twin of the town is the shared data foundation for every step that follows.
The potential analysis looks at where energy can be saved, which renewable energy and waste heat are available locally, and which areas are suitable for a district heating network. Where none is suitable, heating each building separately remains the better option. The result is a target scenario for 2045 and a catalogue of measures. In Mainburg, each measure has a profile with its costs, funding options and climate protection potential.
For a single district, an energy district concept goes into more detail. In the Luitpoldhöhe redevelopment area in Amberg, we recorded renovation status and building age classes on site and built a heat atlas from them. Each measure in the catalogue was assessed for cost-effectiveness, security of supply, social acceptability and ecological effect. In Altrip, we also assessed a district heating network and developed a concept for controlling and monitoring.
Measures only happen if people in the municipality accept them. In Mainburg, that meant public events and workshops; in Amberg, close work with the municipal utility. In all three projects, we delivered the results as a WebGIS that runs in the browser. In Mainburg, it also makes the results accessible to residents.
Heat planning in GOAT
In GOAT, you upload your own data, such as buildings with heat demand or the utility’s networks, and add buildings, settlement structure or population from the Catalog. All layers sit together in one project.
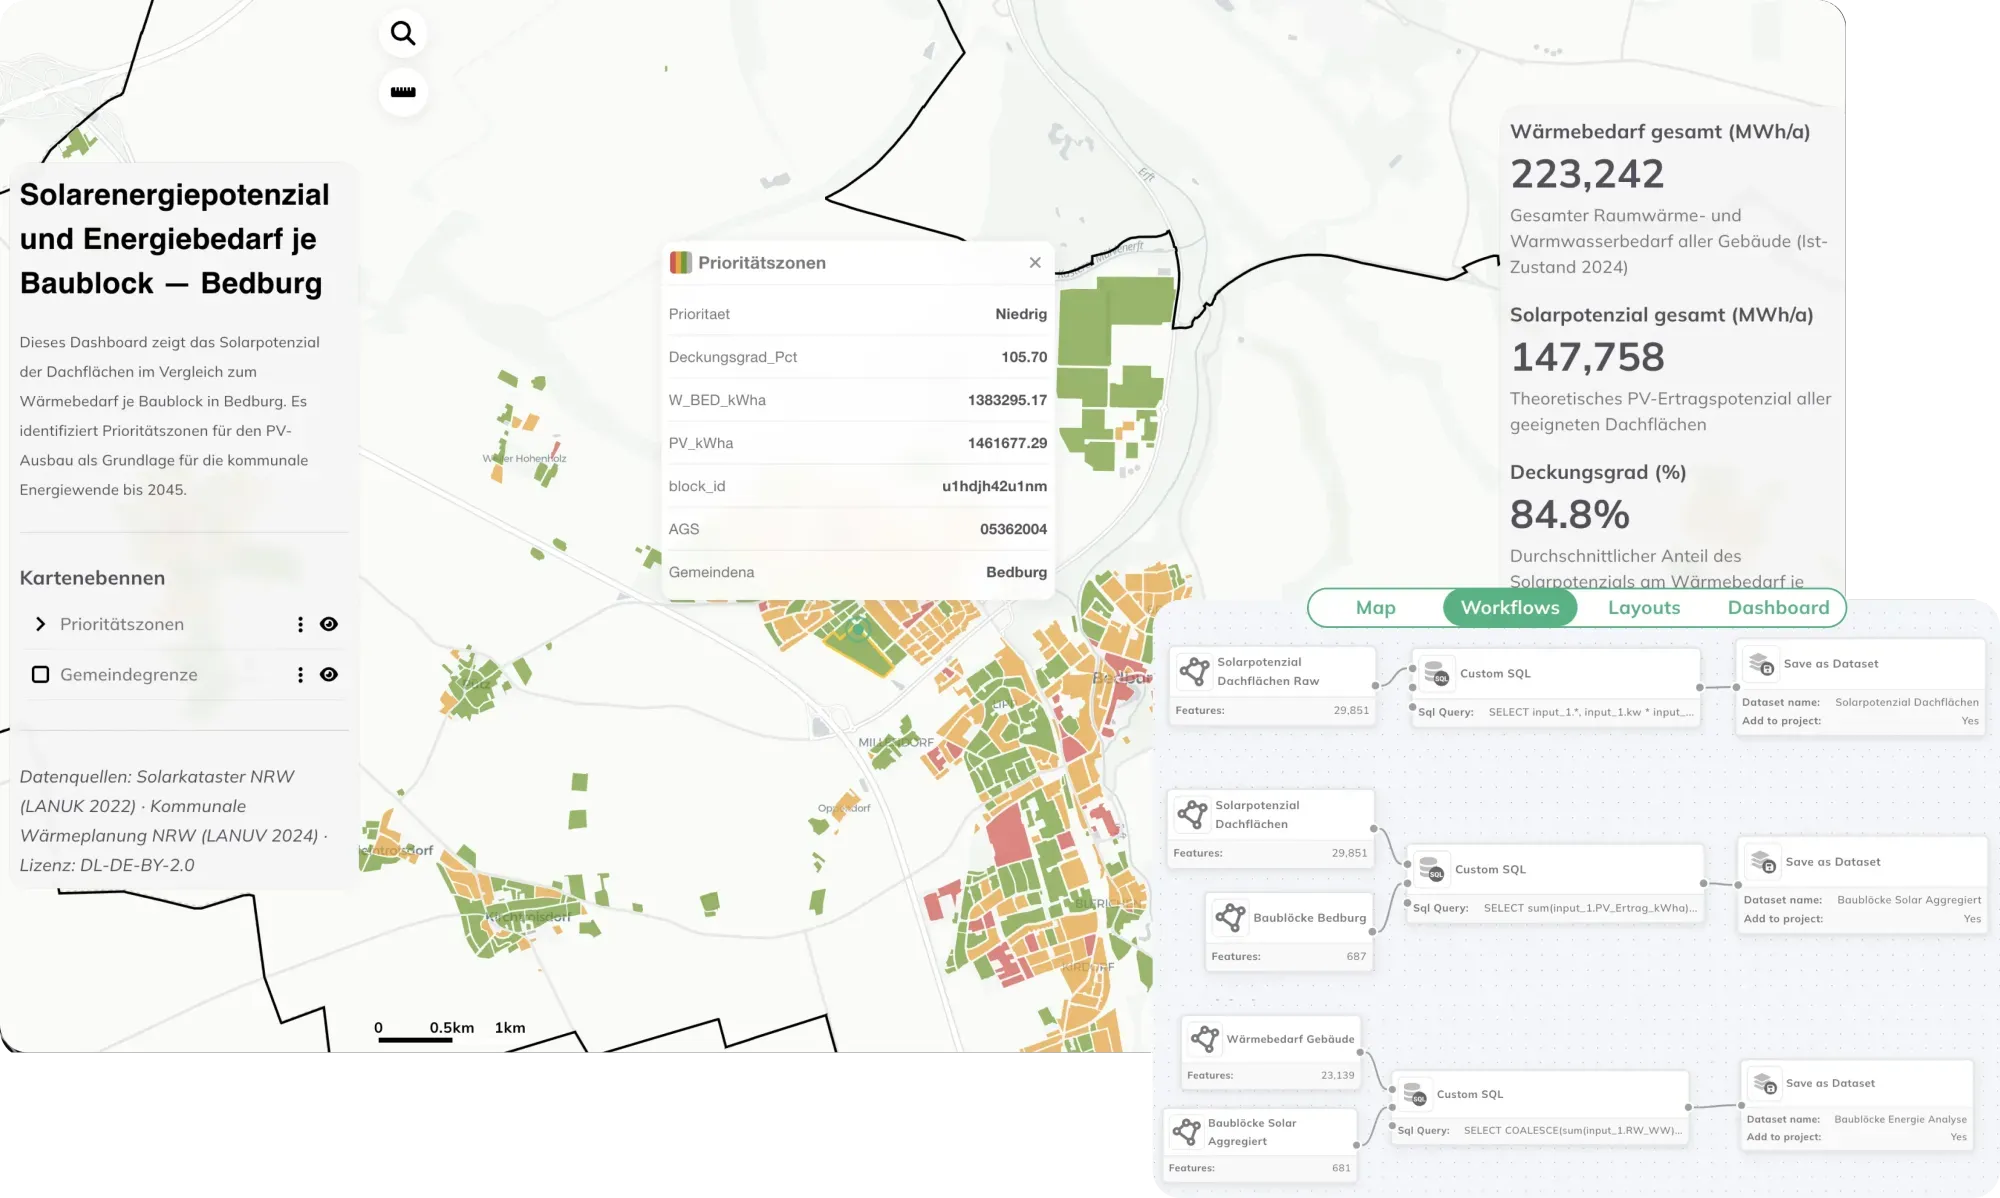
You build the analysis as a Workflow. For Bedburg, a workflow uses SQL queries to sum up the heat demand of buildings and the solar potential of rooftops per block, saves the result as a dataset and adds it to the project. The priority zones for solar expansion come from that result. When the data or the boundaries change, you run the same workflow again. The GOAT documentation explains how workflows are set up.
To present the results, you build a Dashboard with key figures and charts next to the map. In Rheinbach, clicking a building shows its heat demand in a custom Popup, and a chart shows how urgent retrofits are in each block. With Share, you publish the dashboard so it opens without a GOAT account. The documentation also covers how to build a dashboard.
You can open both examples in our gallery: heat planning in Rheinbach and solar potential and energy demand in Bedburg.
You can run the analysis yourself in GOAT, or work on your heat plan with us. The projects are listed directly below.
From our projects
- Energy
- Cities & Government
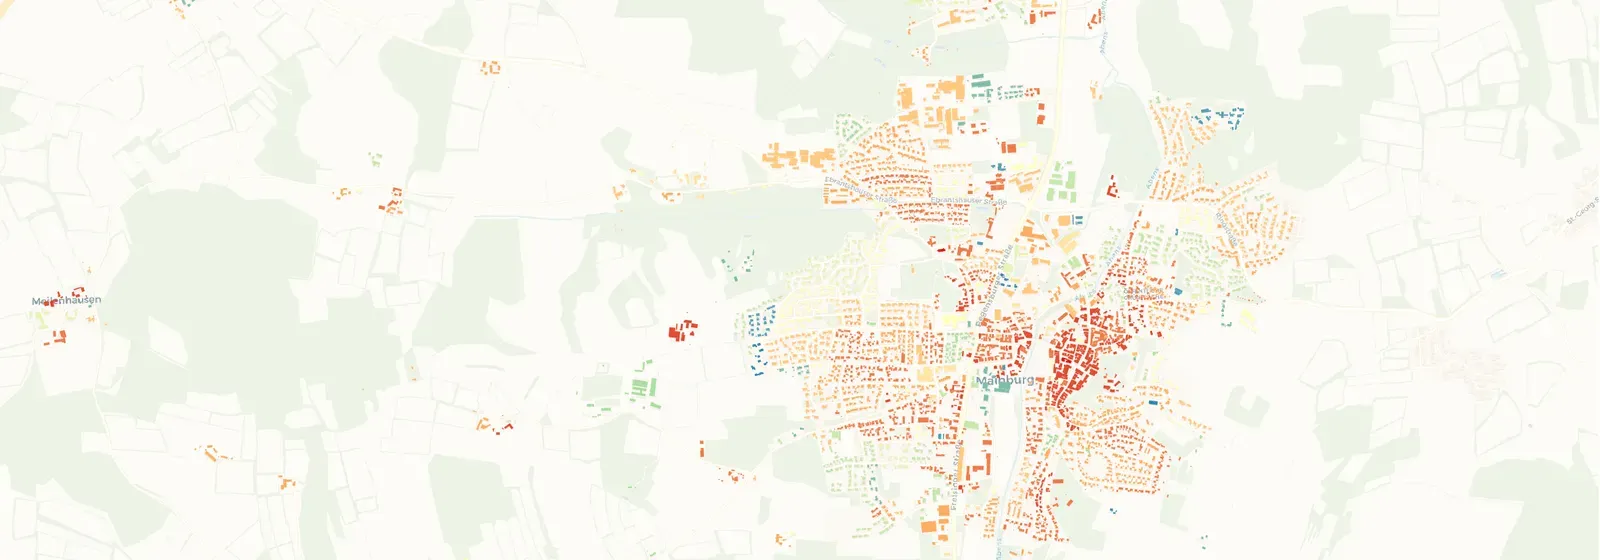
Municipal Heating Plan for the City of Mainburg
Plan4Better, in collaboration with a partner, is developing a municipal heating plan for the City of Mainburg to enable greenhouse gas-neutral heat supply by 2045.
Read the reference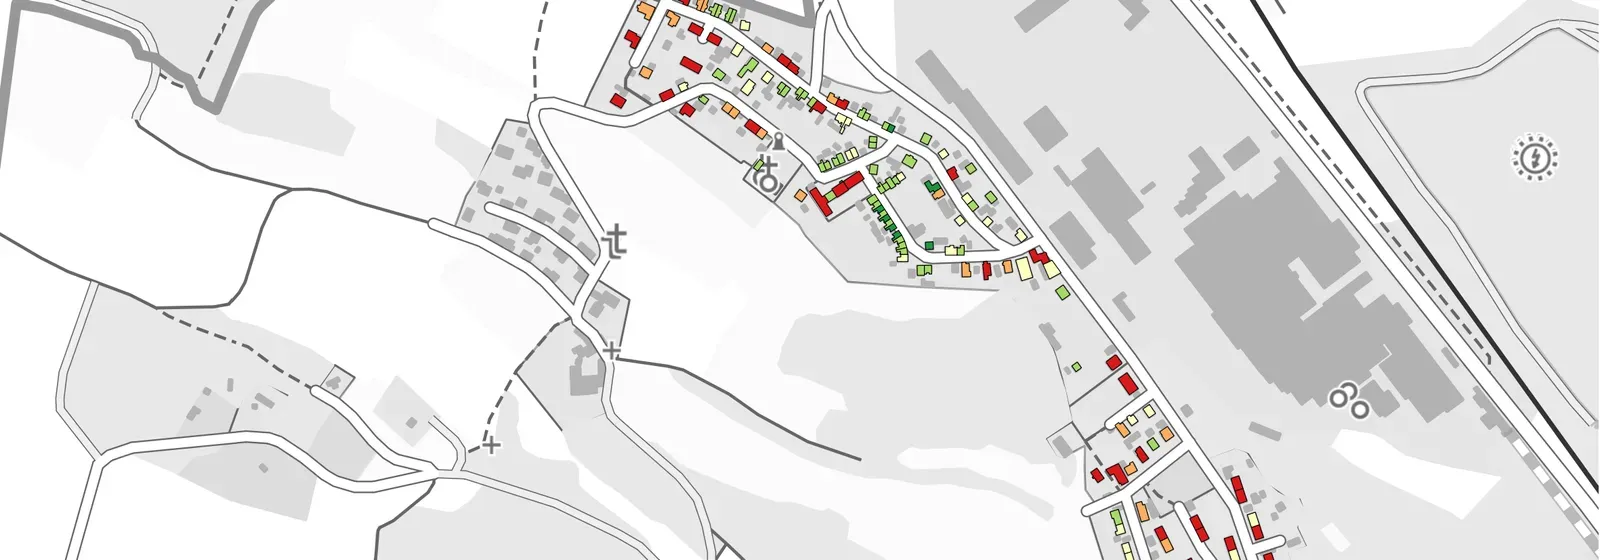
- Energy
Energy District Concept for the City of Amberg
The creation of a heat atlas for the redevelopment area Luitpoldhöhe forms the core of the project aimed at improving energy efficiency and tapping into new energy potential for heat supply.
Read the reference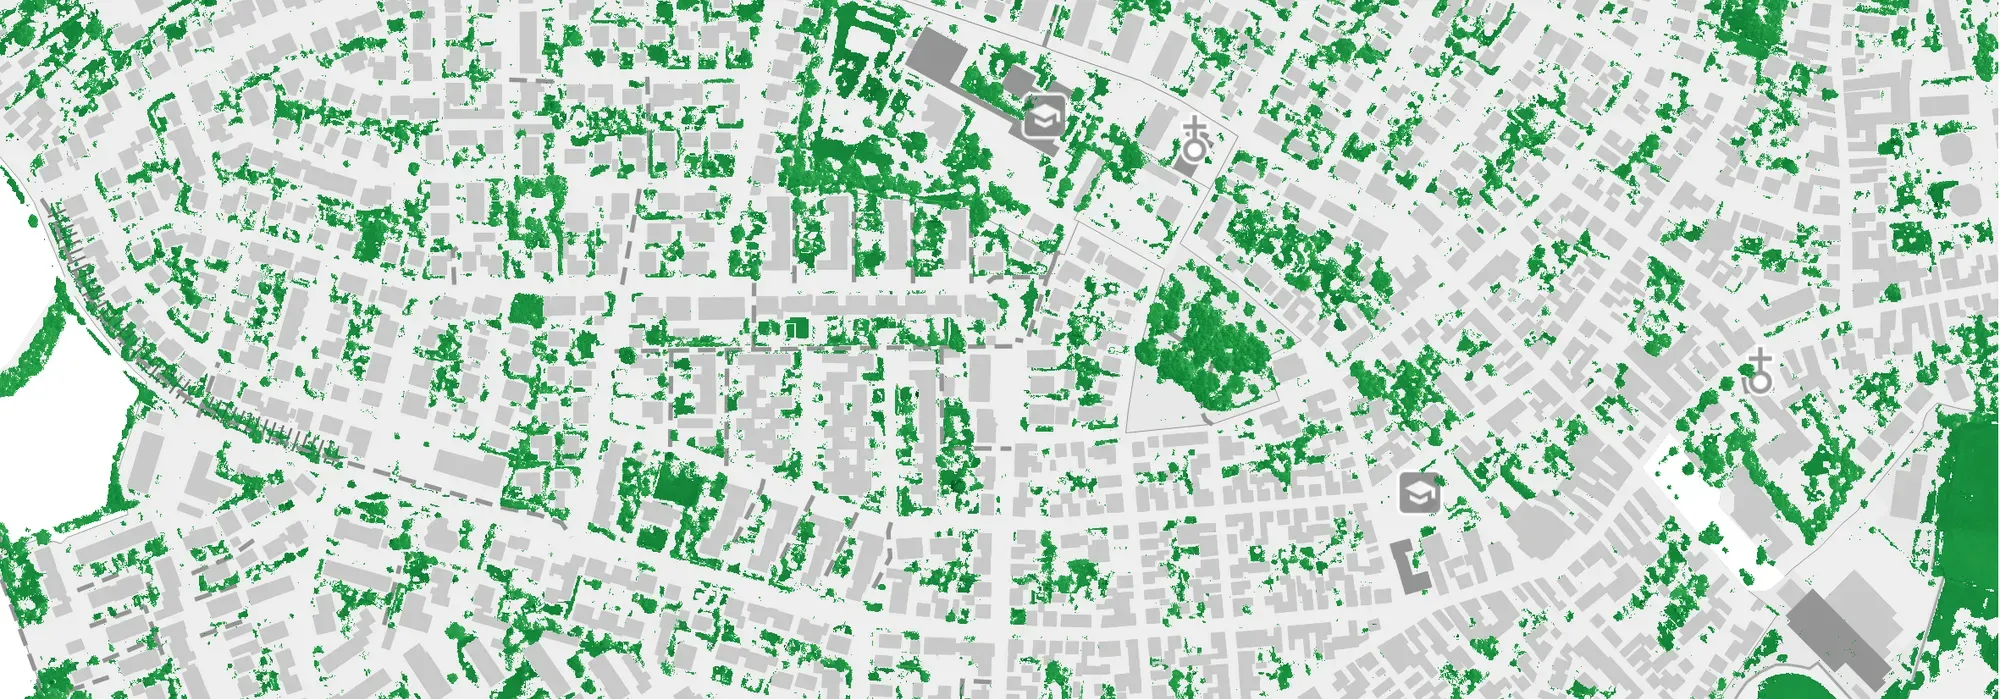
- Energy
Energy District Concept for Altrip
As part of an integrated district concept for the municipality of Altrip (Rhineland-Palatinate), comprehensive analyses and strategies were developed to improve the overall energy, urban planning, and climatic situation.
Read the reference
Frequently asked questions
What is municipal heat planning?
A heat plan sets out how a municipality will make its heat supply greenhouse gas neutral by 2045. It shows which areas suit a district heating network and where buildings will keep their own heating. In Germany, the legal basis is the Heat Planning Act (Wärmeplanungsgesetz, WPG).
When does a German municipality need its heat plan?
Under the Heat Planning Act, cities with more than 100,000 residents had to present their heat plan by mid-2026. All other municipalities have until mid-2028. The federal states set out the details.
What data do you need for municipal heat planning?
For every building: heat demand or consumption, energy source, building type, age and renovation status, plus the gas and district heating networks. The potential analysis also needs data on renewable energy and waste heat. The 2022 German census gives energy sources, and in North Rhine-Westphalia the Energieatlas NRW and the Wärmestudie NRW publish heat demand as open data.
Why use GIS for heat planning?
The central question in a heat plan is spatial: where is heat demand dense enough for a district heating network to pay off? A GIS brings buildings, networks and potential onto one map and sums them up per block or district. That makes areas comparable, and lets you draw their boundaries.
How is a heat plan different from an energy district concept?
A heat plan covers the whole municipality. An energy district concept goes deeper for one district, down to a catalogue of retrofit measures. In Amberg, that meant recording renovation status and building age on site in the Luitpoldhöhe redevelopment area.
Can residents see the results of the heat plan?
Yes, if the municipality wants that. A map or dashboard in GOAT can be shared publicly, so nobody needs an account to open it. In Mainburg, a WebGIS made the results accessible to stakeholders and residents.
Is a heat plan coming up in your municipality?
Book a slot and we will look at your data and your building stock together.
- Heat demand, energy sources and networks for every building on one map.
- Define the areas for district heating and for individual heating.
- Compare renewable potential and waste heat with demand.
- A WebGIS for the administration, the council and residents that stays in use after the project.
Ready to make sense of your data?
Join planners, organizations and cities using GOAT to make better decisions, faster. No GIS expertise needed.