
Back to the Gallery Map Gallery
Municipal Heat Planning: Heat Demand & Retrofit Priorities in Rheinbach
Germany has given every municipality a legal deadline to plan its heat transition — but the data to do it usually arrives as a stack of incompatible spreadsheets. This dashboard pulls it onto one map for the town of Rheinbach: the heat demand of all 14,961 heated buildings, the streets and blocks where demand runs highest, the dominant energy source per block (still 38.7% natural gas), and the buildings flagged as retrofit priorities where action matters most. Built to support the municipal heat plan required under Germany’s Heat Planning Act (WPG 2024), it turns the path to a climate-neutral heat supply by 2045 into something a planner can actually see and work from. The data comes from the open Energieatlas NRW and Wärmestudie NRW (2024).
Is your municipality on track for its heat plan?
More maps to explore
- Energy
- Sustainability & Climate Risk
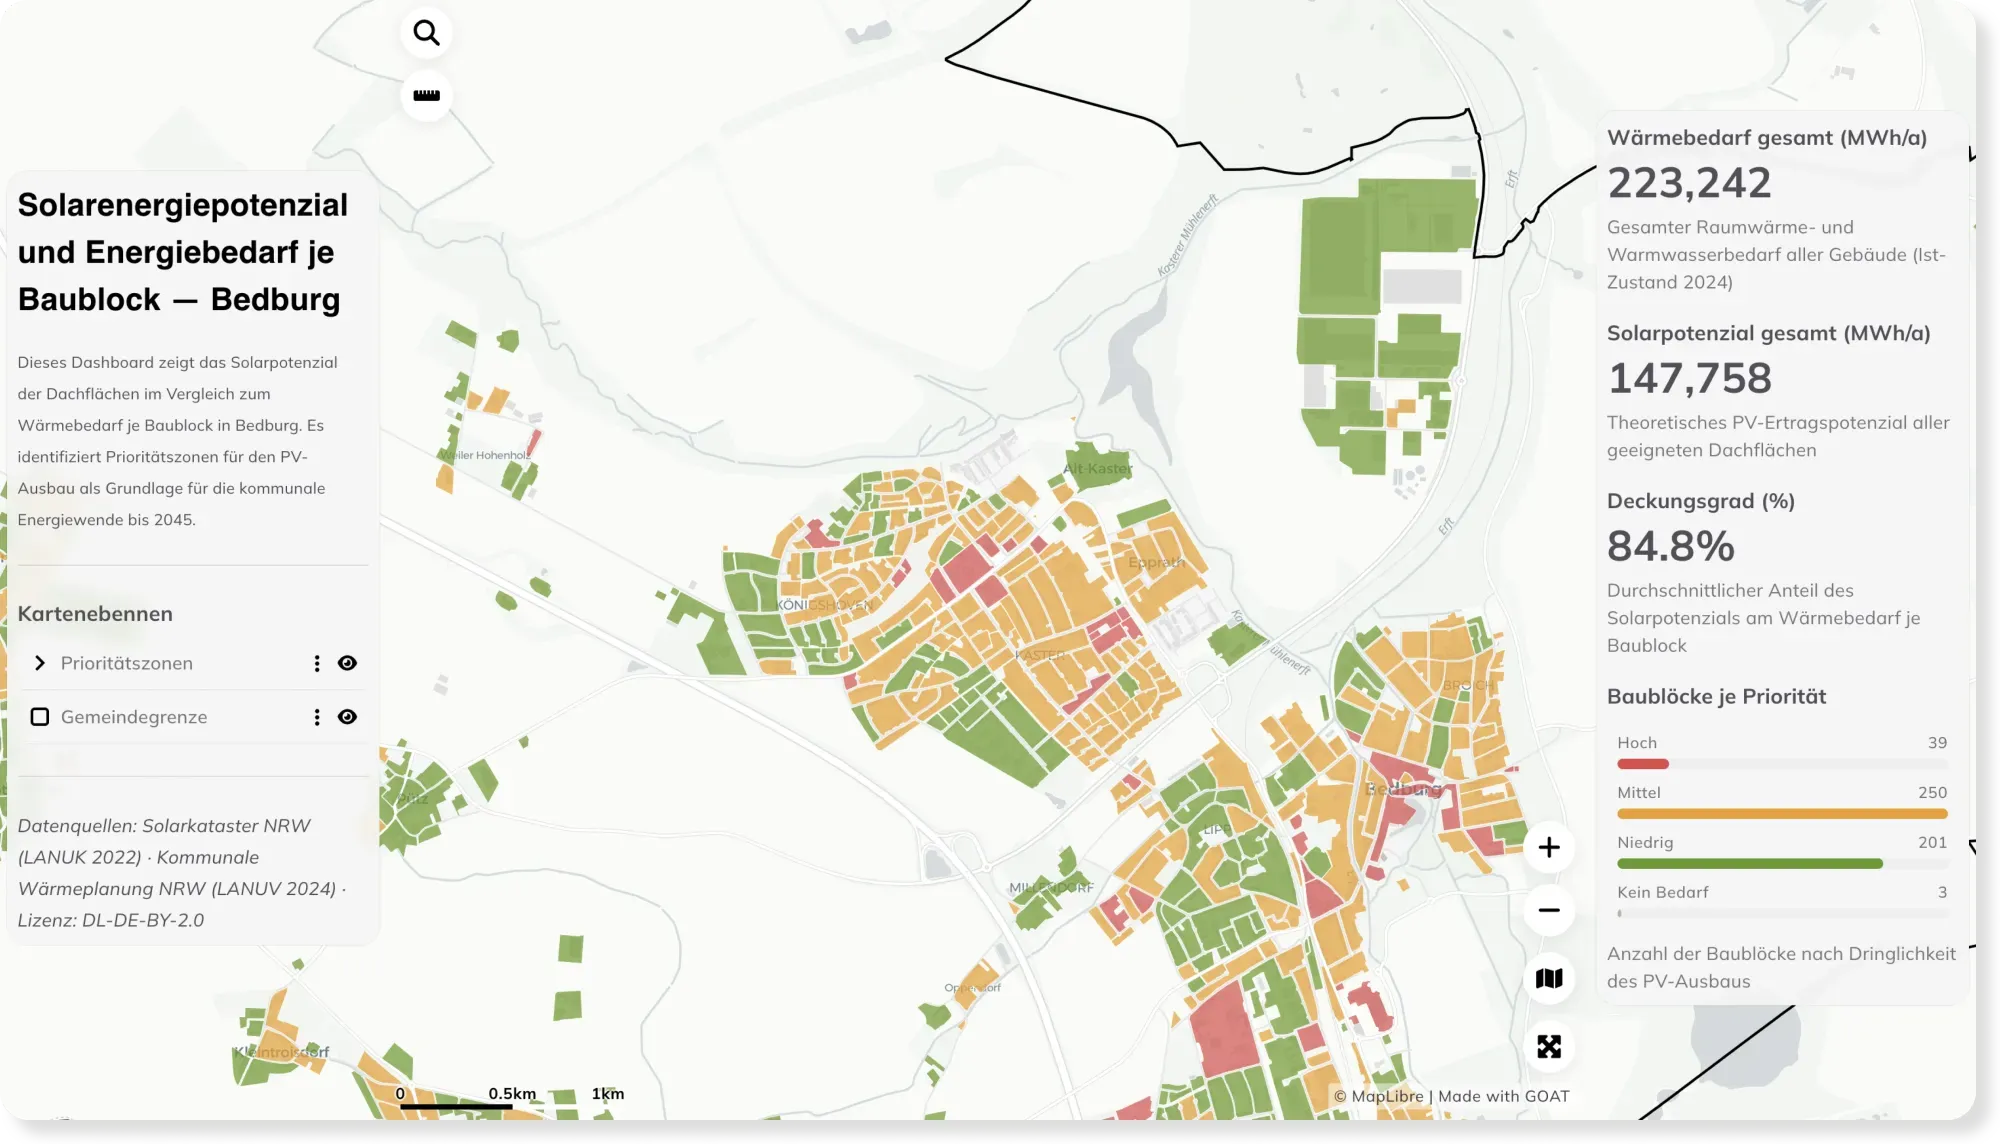
Rooftop Solar Potential vs. Energy Demand per Block — Bedburg
How much energy could a city's rooftops cover? This dashboard compares rooftop solar potential with heat demand per block in Bedburg, revealing priority zones for solar expansion.
See the map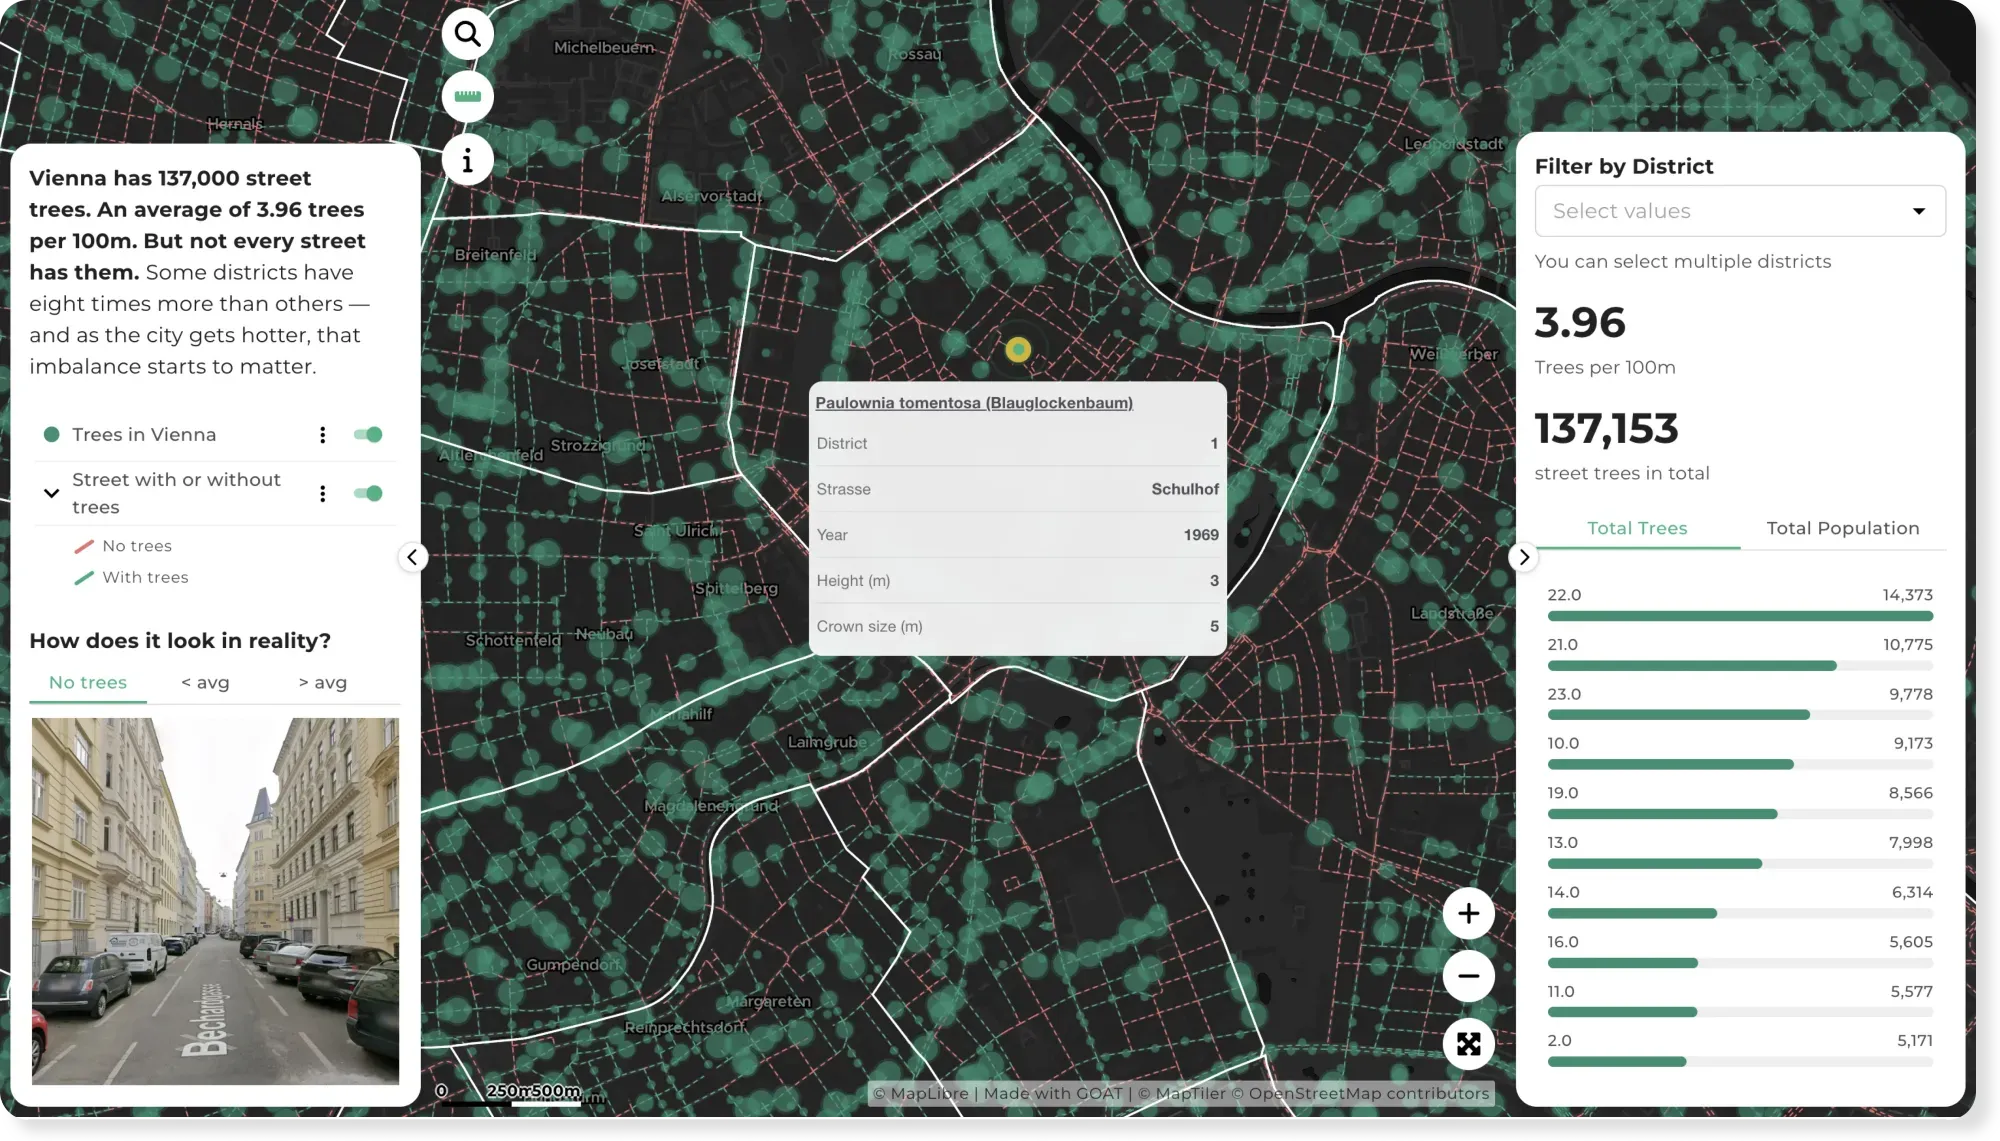
- Sustainability & Climate Risk
- Cities & Government
Vienna's 137,000 Street Trees — and Where the Shade Runs Out
Vienna has around 137,000 street trees — but some districts have eight times more than others. This map shows where the street canopy gives shade, and where it doesn't.
See the map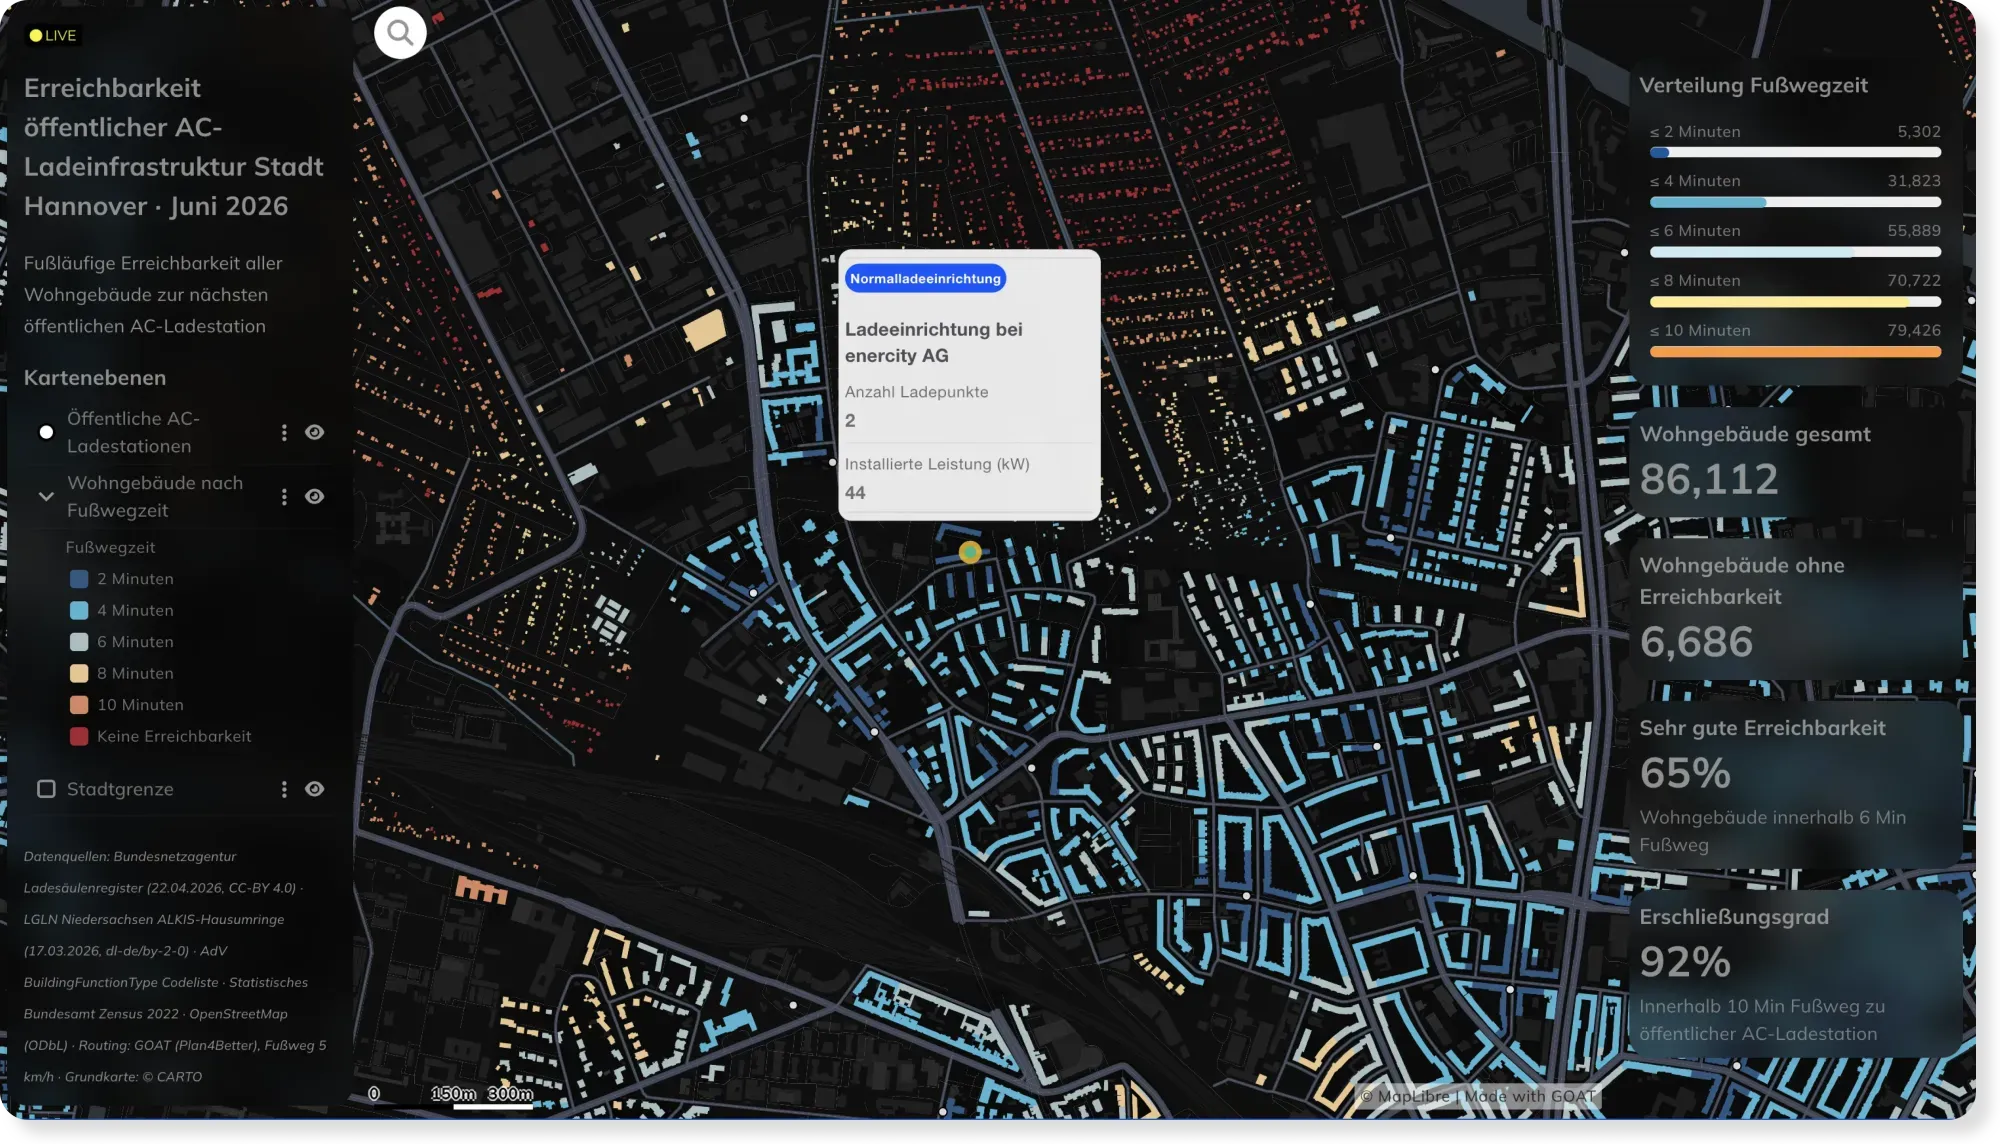
- Energy
- Mobility Planning
Live EV Charging Accessibility in Hannover, Powered by Automated Workflows
Charging networks change weekly. This Hannover dashboard stays current automatically — custom SQL and scheduled workflows recompute walking access to every AC charger as the data updates.
See the map
Rather see it on your own data?
Book a slot and we will walk through GOAT with the questions you actually have.