
Solutions
Accessibility analysis for municipalities
Counting the doctors, nurseries or supermarkets in a district tells you little about who can reach them. An accessibility analysis measures how long the journey takes, on foot, by bike and by public transport. We calculate it in GOAT for neighbourhoods, towns and whole regions.
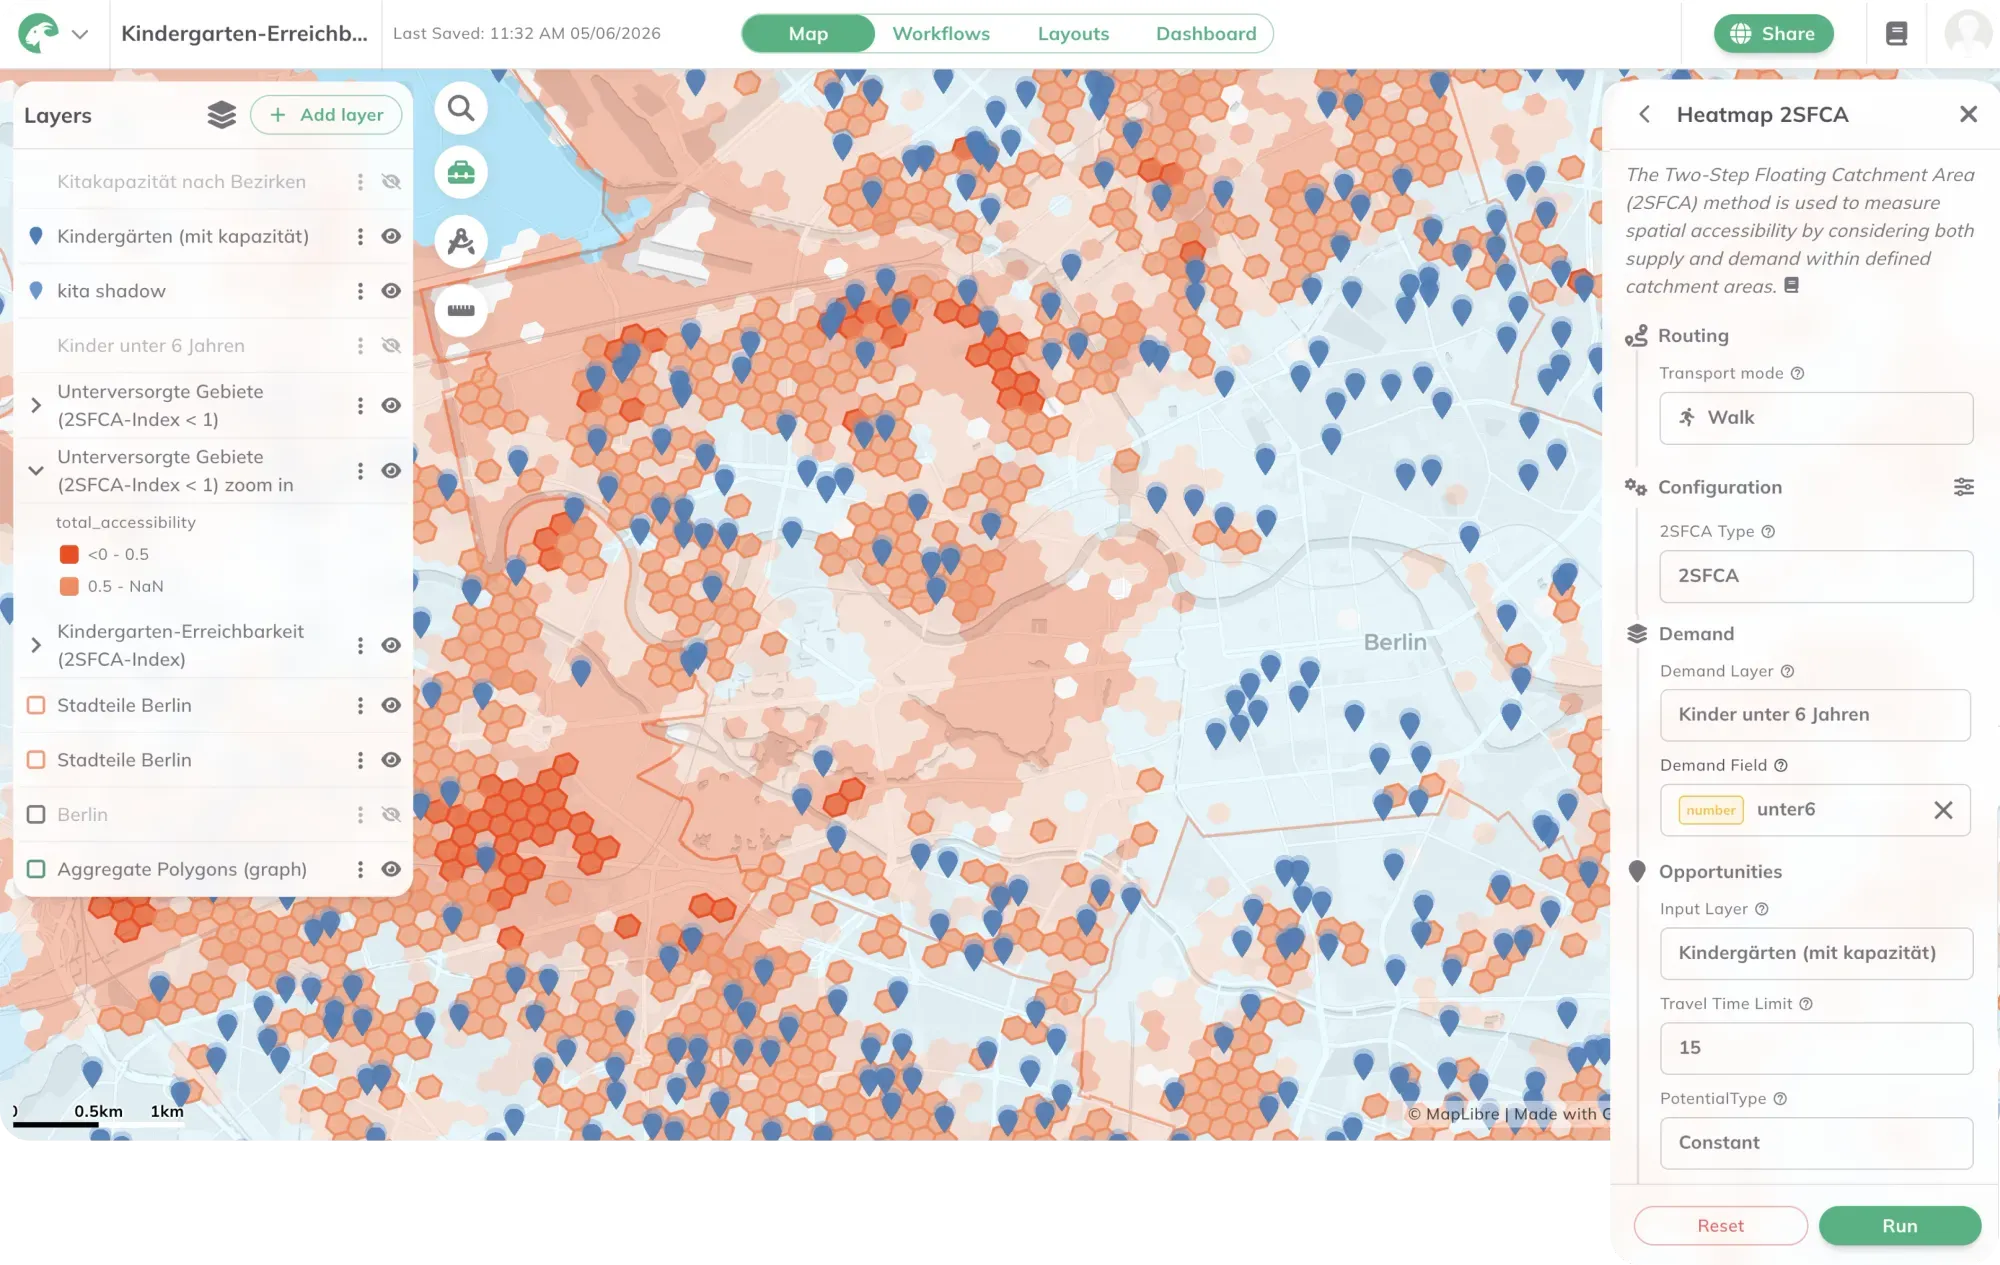
Having services is not the same as reaching them
A municipality can count how many GP practices, nurseries or supermarkets each district has. That number does not say how long it takes to get there. A district with four playgrounds can be worse served than a district with two, if the four sit at one edge and the two sit in the middle. And a nursery five minutes away does not help a family if every place is taken.
The difference is clearest when facilities close. In Saarland, more than 30 per cent of maternity wards have closed since 2014. We used GOAT to see what that means for journeys. Over 200,000 people, more than 20 per cent of the population, now need more than 30 minutes by car to reach the nearest maternity ward. By public transport, more than 65 per cent need over 40 minutes.
Municipalities, districts and planning offices face very practical questions. Which parts of town have no GP within reach without a car? Where is a link missing in the walking or cycling network? Where would a new stop or a new nursery make the most difference? These questions are part of mobility plans, in plans for walking and cycling at neighbourhood level, in healthcare planning and in every choice of site. An accessibility analysis answers them for every part of the area, not as one average for the whole municipality.
How an accessibility analysis works
An accessibility analysis combines three things: where people live, where the destinations are, and how long it takes to travel between them. For a short definition, see our glossary. This page is about how we do it.
It starts with four choices: which destinations count, by which mode, within what time, and for whom. A threshold of 15 minutes and one of 30 minutes give two different maps of the same region, and both can be justified. So the values you chose belong in every result.
Which method fits depends on the question. The simplest is the catchment area. An isochrone shows how far you can get from a facility in a given time, along the real street network, and how many people live inside it. Heatmaps rate every cell of a grid instead, for example by the average travel time to the nearest destinations, or by how many attractive destinations are nearby. Where capacity is limited, such as in childcare or doctors’ practices, 2SFCA compares supply with demand. For public transport, it also matters how often a bus or train runs, and that is what public transport quality classes measure. Our guide to GOAT’s eight accessibility tools shows when to use which, on one example from Bonn.
The result is a map of service gaps: the places that fail the test you defined. Add population data and you also know how many people live there.
An accessibility analysis measures how long a journey takes, not how good it is. Whether a pavement is wide enough, lit and step-free is often missing from standard network data. In Augsburg, we added this through a site survey, including street lighting, crossings and barriers, and used it to calculate a walkability index.
Accessibility analysis in GOAT
In GOAT, the tools are under Accessibility Indicators. With Catchment Area you calculate isochrones by time or distance, for Walk, Bicycle, Pedelec, Car and Public Transport. The heatmaps, among them Heatmap - Closest Average, Heatmap - Gravity and Heatmap 2SFCA, rate the whole area on a grid. For public transport there are also ÖV-Güteklassen and Trip Count Platform. The GOAT documentation explains each setting of the catchment area tool.
The routing networks for walking, cycling and driving cover more than 30 European countries. Public transport covers Germany, Switzerland and the Haut-Rhin region in France. You add destinations, population and administrative boundaries to your project from the data catalog, or upload your own data, such as the childcare places in your town. Save the steps as a workflow and run it again when the data changes.
We use the same tools in our projects. In Sinsheim, we assessed the walking, cycling and public transport networks for the whole town and combined them with origin and destination data from mobile phones. For the Munich district of Allach-Untermenzing, we are working with Sweco on access on foot, by bike and by public transport, together with site visits and public participation. For the MOBITAT project, we calculated for all 520 municipalities of the Frankfurt Rhine-Main region what share of the population reaches everyday destinations by bike and by public transport within 5, 10, 15, 20 or 25 minutes. In the district of Südliche Weinstraße, we looked at how visitors reach tourist destinations by bus and train, including the VRNflexline on-demand service.
You can run the analysis yourself in GOAT, or ask us to do it for your area. The projects are listed directly below.
From our projects
- Cities & Government
- Mobility Planning
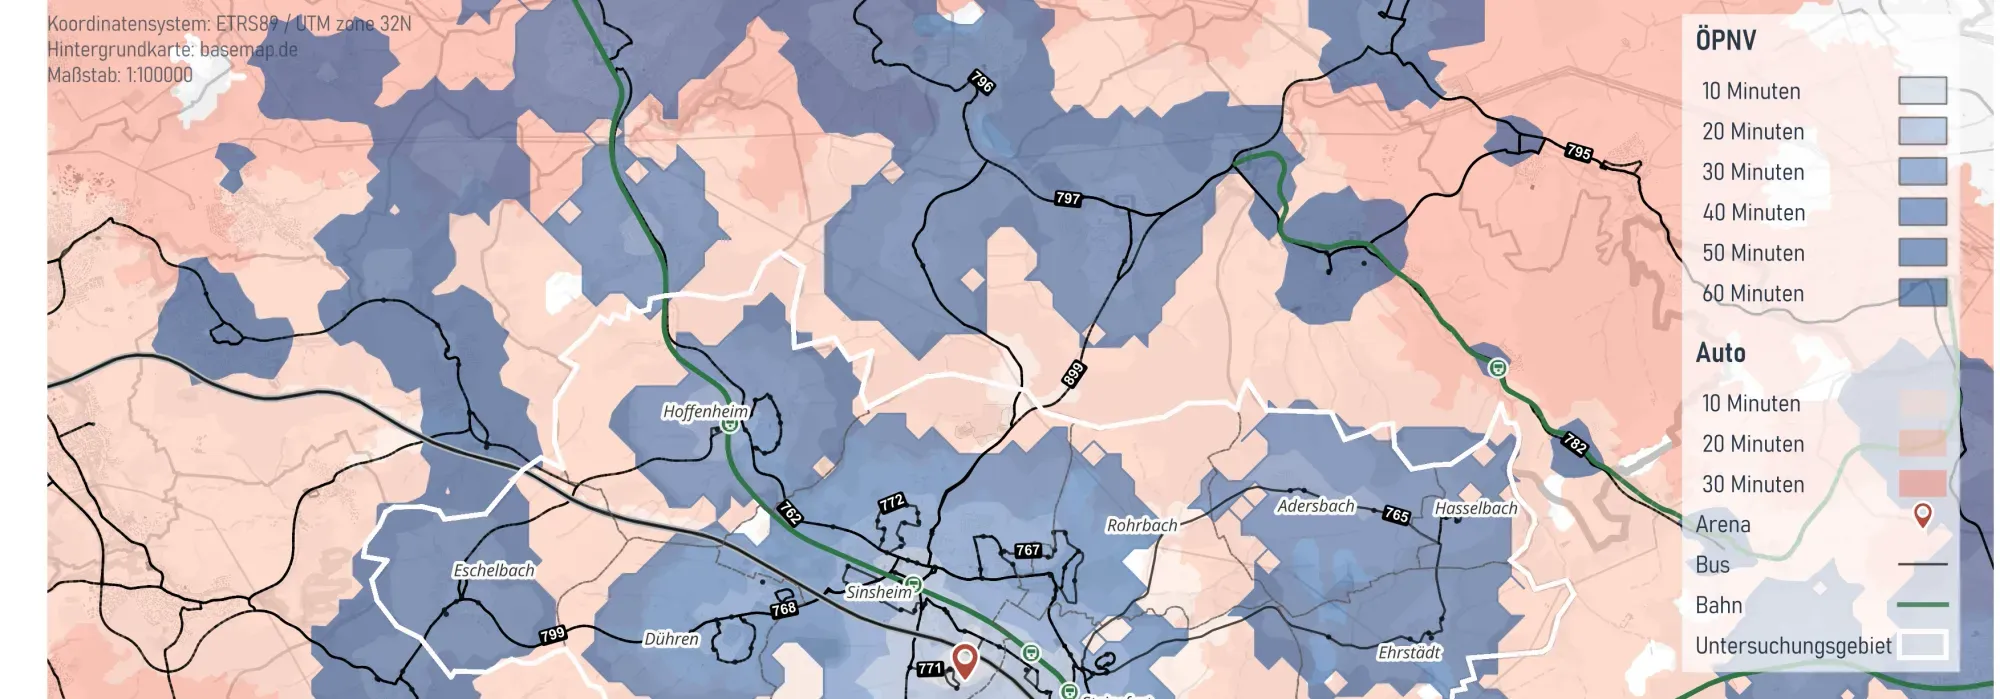
Integrated Mobility Analysis for the City of Sinsheim
The City of Sinsheim commissioned Plan4Better to carry out an integrated mobility analysis of cycling, walking and public transport to reduce the high dependency on private motor traffic and identify improvement potentials for the city’s various transport modes.
Read the reference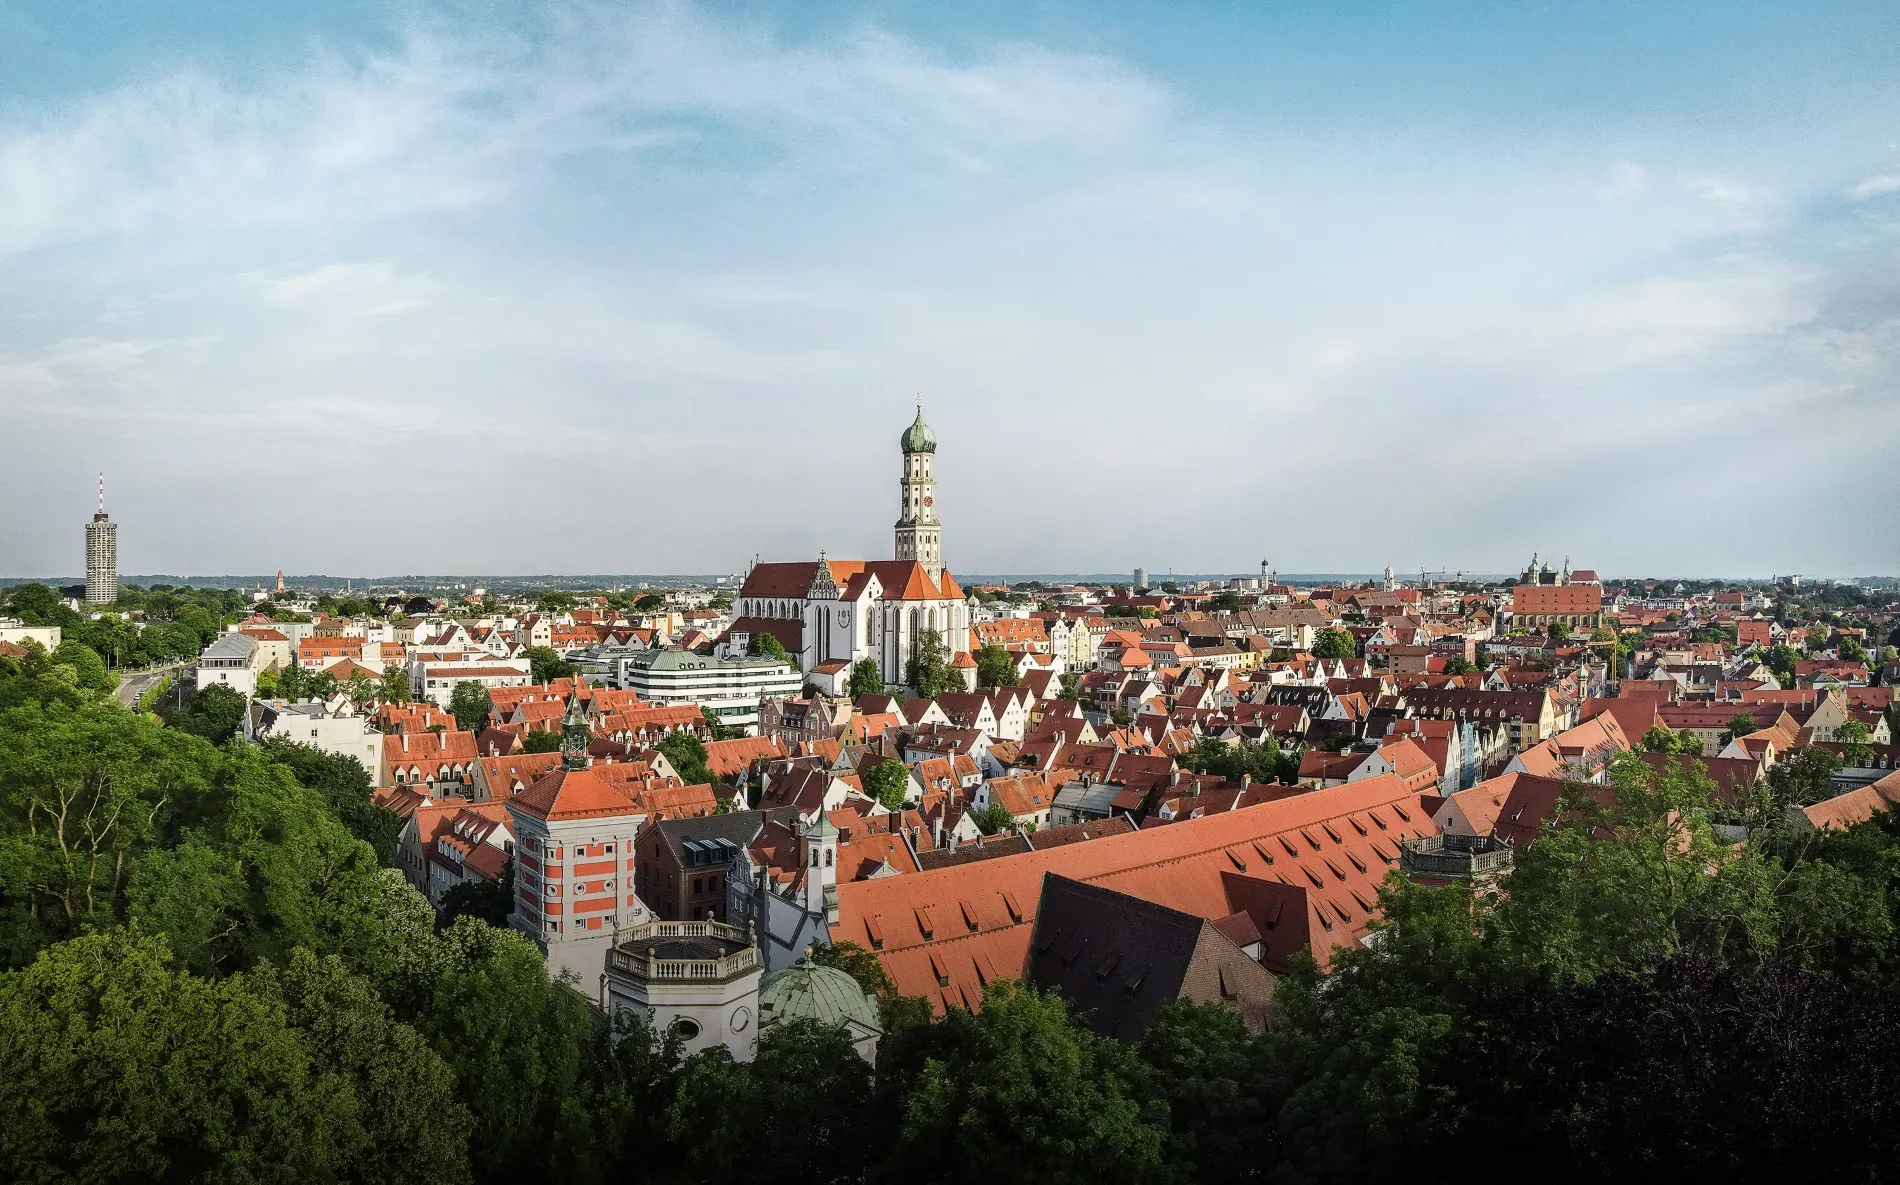
- Cities & Government
- Mobility Planning
Accessibility and Walkability Analyses in the City of Augsburg
To explore how accessibility, oriented towards sustainable mobility, can be practically measured and evaluated, the City of Augsburg is examining approaches such as Public Transport Quality Classes (ÖV-Güteklassen) and the assessment of pedestrian-friendliness of street and pathway networks.
Read the reference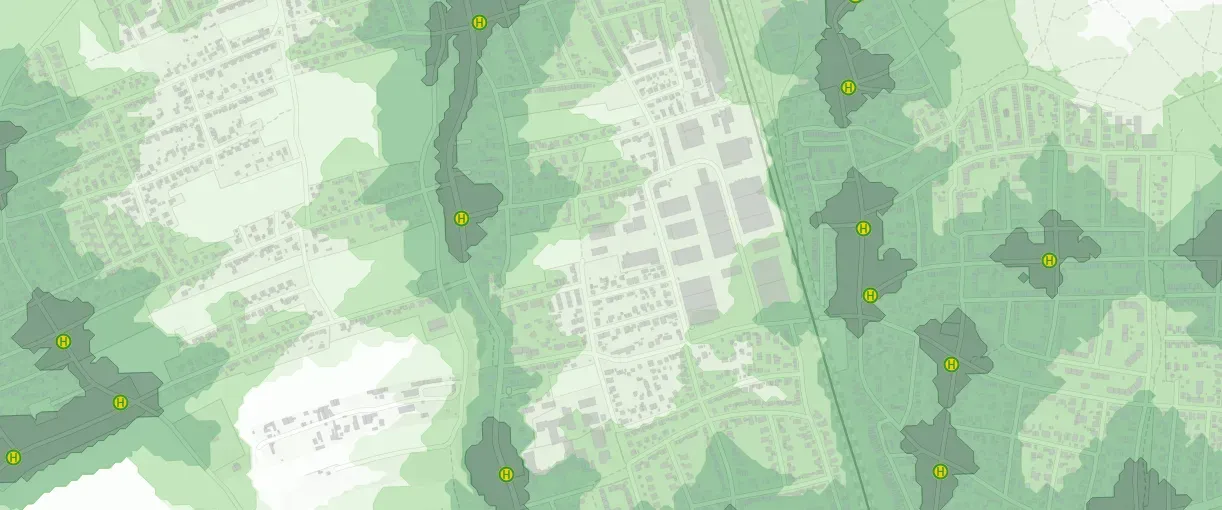
- Cities & Government
- Mobility Planning
Active mobility concept for the Munich district of Allach-Untermenzing
The active mobility concept for Allach-Untermenzing combines detailed data analysis with active citizen participation to develop sustainable, tailored mobility solutions that directly address the everyday needs of local residents.
Read the reference
- Mobility Planning
Accessibility Analysis for project "MOBITAT"
Conducting accessibility analyses with GOAT for cycling and public transport for the 520 municipalities in the Frankfurt-Rhine-Main metropolitan region.
Read the reference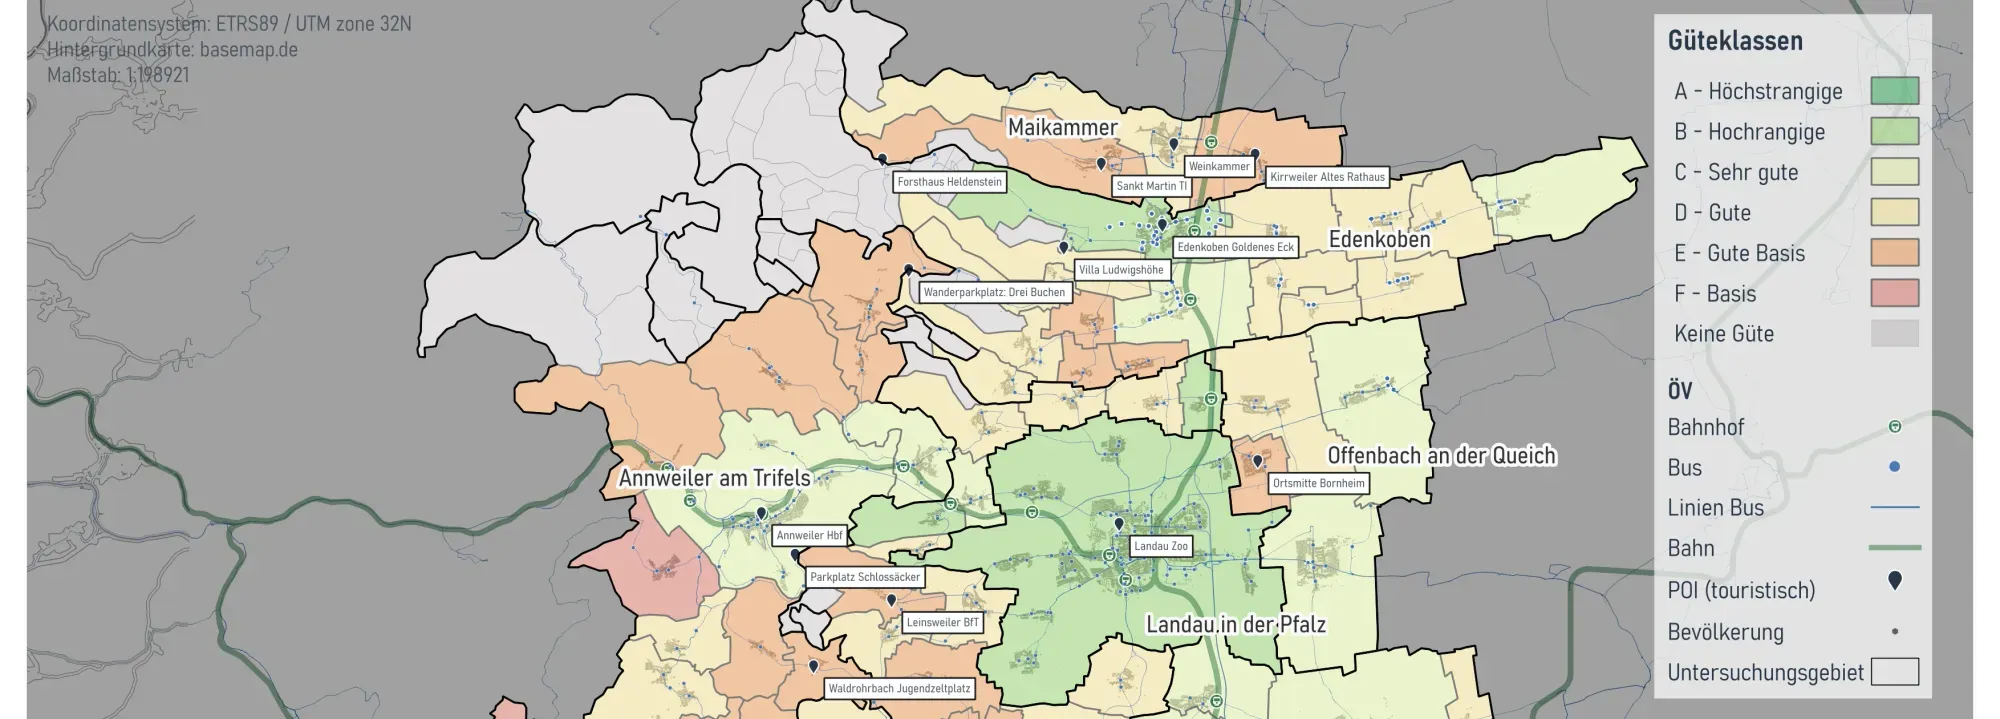
- Cities & Government
- Mobility Planning
Mobility Analyses for Südliche Weinstraße
On behalf of the District of Südliche Weinstraße, we conducted a public transport (ÖPNV) study on the accessibility of tourist destinations by local transit.
Read the reference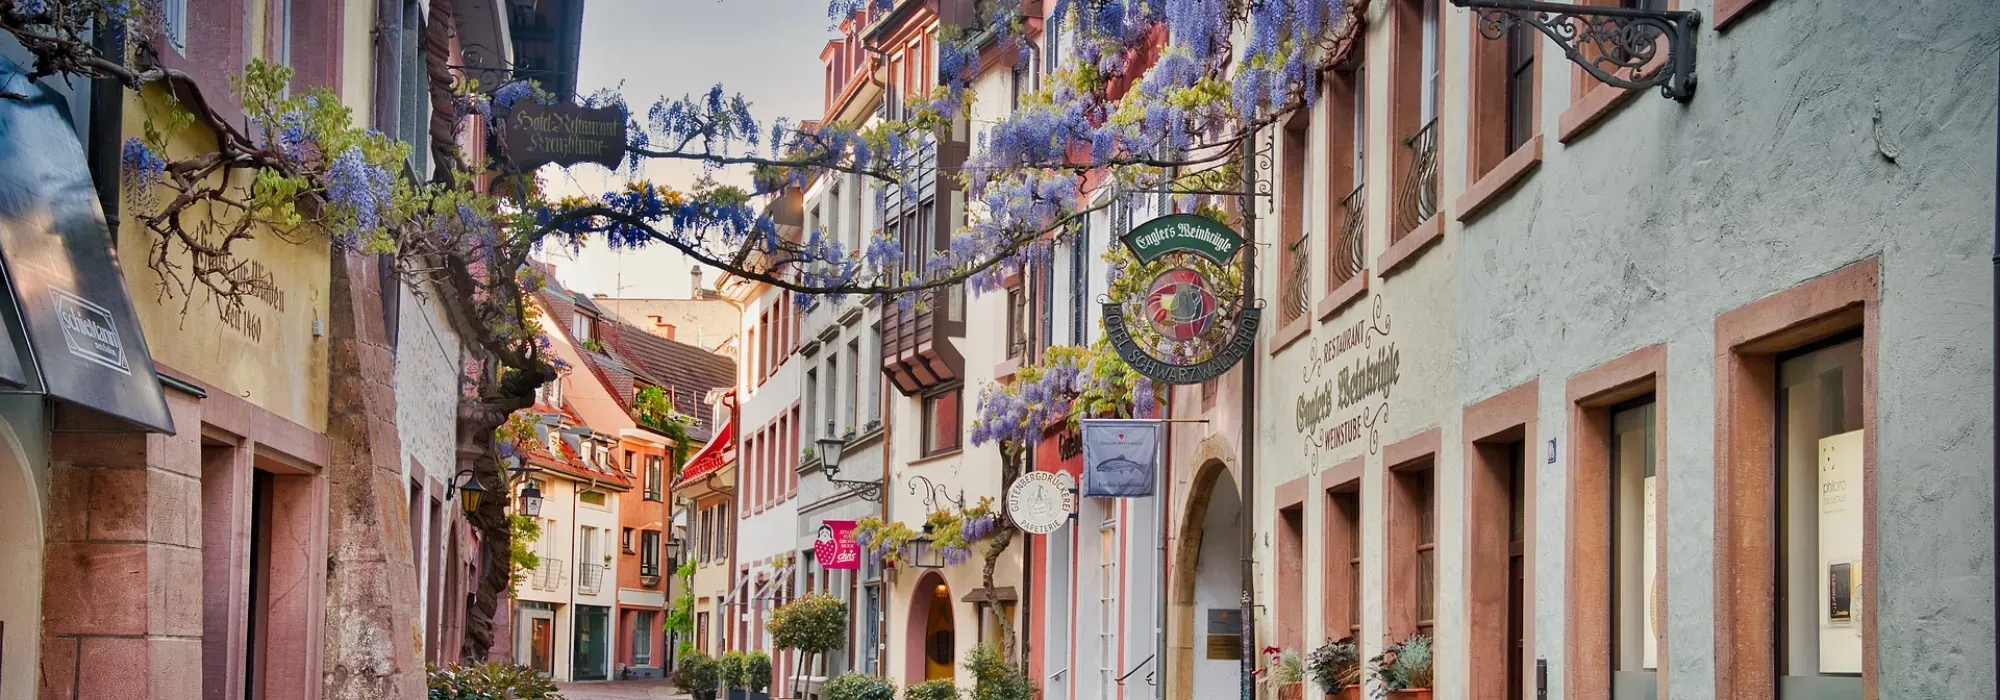
- Cities & Government
- Mobility Planning
- Retail
Freiburg - GOAT Subscription
With the GOAT subscription, planners from the City of Freiburg and the local transport provider produce accessibility analyses for a wide range of planning issues.
Read the reference
Frequently asked questions
What is an accessibility analysis?
An accessibility analysis measures how easily people can reach the places they need from where they live, such as schools, doctors, shops or green space. It combines three things: where people live, where the destinations are, and how long it takes to travel between them.
What data do you need for an accessibility analysis?
A street and path network, the locations of the destinations, and population data, such as the 100-metre grid of the 2022 German census. For public transport you also need timetable data in GTFS format. To show whether there are enough places, you need the capacity of each facility as well, for example childcare places.
What is the difference between an isochrone and a radius?
A radius measures distance in a straight line. An isochrone follows the real street network and shows how far you can get in a given time. Rivers, railway lines or missing crossings make it smaller. A radius ignores such barriers.
Can I run an accessibility analysis myself in GOAT?
Yes. Under Accessibility Indicators you will find catchment areas, several heatmaps and public transport quality classes. The City of Freiburg and the Freiburg transport company VAG have used GOAT this way with their own licences since 2022. If you prefer, we carry out the analysis for you.
How do you find gaps in access to childcare or GPs?
First you define what counts as accessible: which destination, within what time, by which mode. The areas that fail this test are the gaps. For childcare and doctors, capacity matters too. The 2SFCA method compares the places a facility offers with the number of people in its catchment area.
Want to measure accessibility in your municipality?
Book a slot and we'll look at your question, your area and the data you already have.
- Journeys to schools, childcare, GPs, shops and stops, on foot, by bike, by public transport or by car.
- Service gaps on the map, at small scale, with the number of people who live there.
- Supply and demand assessed together where places are limited, such as in childcare or doctors' practices.
- Maps and reports for council meetings and public consultation.
Ready to make sense of your data?
Join planners, organizations and cities using GOAT to make better decisions, faster. No GIS expertise needed.