
GOAT 3.1 “Alpine”: an AI assistant that builds your analyses
GOAT now has an assistant that answers questions about your projects and builds, checks and runs analyses as workflows, hosted in the EU. Around it: a PT Network Explorer for GTFS feeds, ÖV-Güteklassen walked along the street network, and layer switchers in dashboards.

GOAT 3.1 is out, six weeks after 3.0. Where 3.0 changed where a project starts, 3.1 changes how you get through it.
The headline is GOAT AI: an assistant inside GOAT that you ask in your own words. Around it come four changes you will notice in daily work: a way to explore a public transport network on the map, a more realistic ÖV-Güteklassen, dashboards that switch between layers, and a clearer picture of what your organization uses.
1. GOAT AI: it answers your questions and builds your analysis
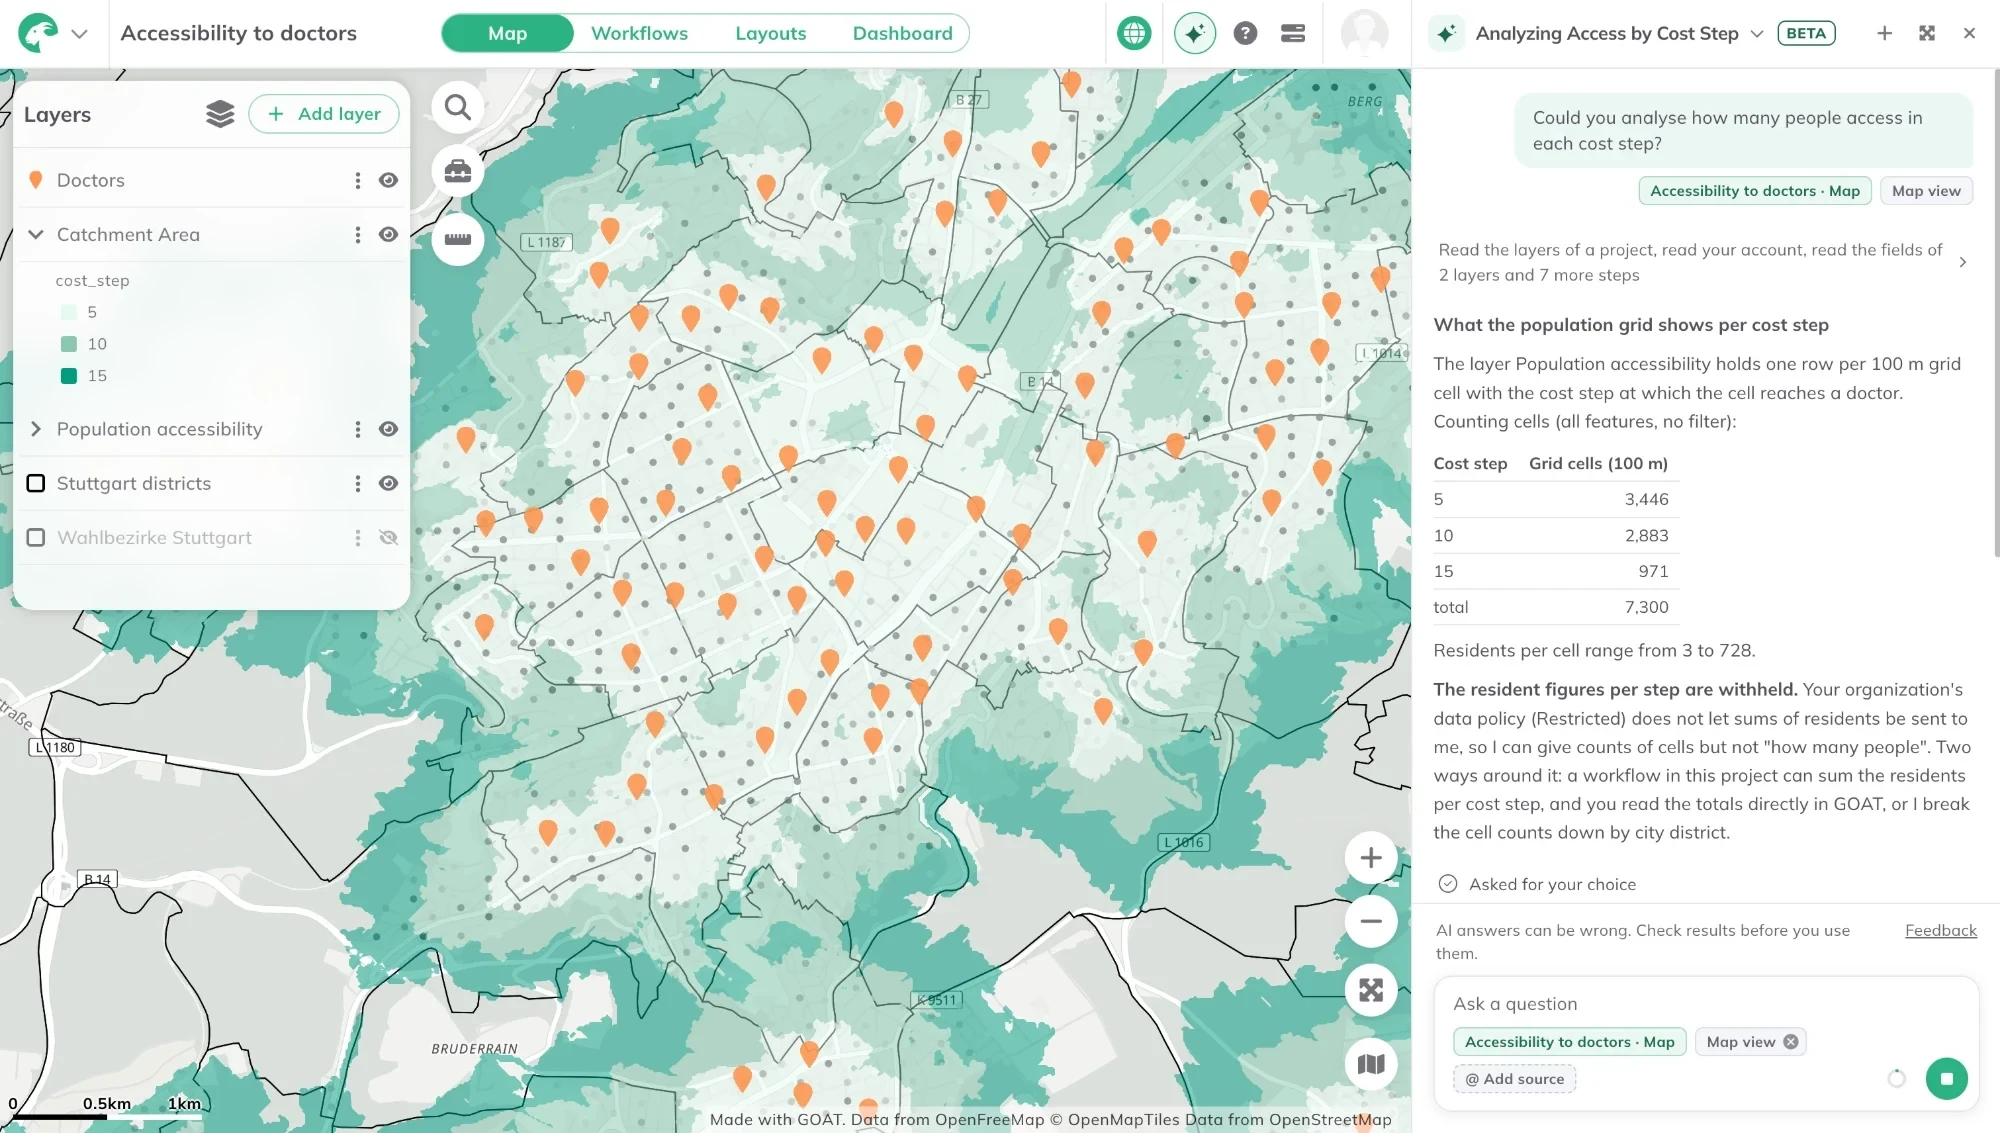
Click Ask AI in the upper bar and a dock opens next to your project. You write a planning question, and the assistant looks for the data, builds the analysis as a workflow, asks you back when something is unclear, and answers the question you started with.
In short, it does three kinds of work.
Finding data. Ask “Which of my projects use cycling data?” or “Which datasets are there about population?”. The assistant searches your workspace, what is shared with you, and the Catalog at the same time, and shows your organization’s datasets first. Each result comes as a card you can open, preview or add to the project.
It also finds projects you have lost track of. Ask “I had a project on access to public transport stops in Hamburg, can you find it?” and it brings it up.
Answering questions about a project. Ask “How many bus stops lie in the district of Pasing?” and it counts them. Or ask “What is this project about?” and it describes it, from the data to what it shows. That helps when someone hands you a project and you need to find your way into it on your own. It also lists fields, describes values, computes areas and statistics per group, and calculates shares against another layer. The numbers are computed by GOAT, not by the model: the assistant writes about them only after GOAT has calculated them.
Building analyses. Describe what you want to know, and the assistant builds it as a Workflow: from a fitting template, or from the tools in your Toolbox. It checks the workflow the way the editor does, runs it and reads the results back to you. The editor follows its edits as they happen, and every answer that changed something can be undone.
Asking GOAT AI a planning question about Wiesbaden.
Two things matter as much as what it can do.
It works with your permissions. Every step runs with your sign-in. The assistant only finds what you could open and only changes what you could edit. In a project you can only view, it answers but changes nothing. It never deletes a project, dataset or workflow.
Your organization decides what reaches the model. Admins switch AI on or off, and choose GOAT AI, included and hosted in the EU, or a connection of their own. A data policy sets how much the model sees: under Standard, everything a member can see; under Restricted, only field names, types, counts and statistics, never single rows or geometries.
The assistant is in beta, and AI answers can be wrong. Each answer shows the steps it took, so you can check where a number came from, and you can rate it with the buttons below it.
If you work with your own AI tools, GOAT also has an MCP endpoint. External agents connect with the permissions of the person who connects them, and for now they get the Catalog tools: search, filters, regions and dataset records.
2. AI credits and a new Usage page
Answers from GOAT AI are paid from a monthly pool of AI credits per organization. With the standard terms, a subscription gets 200 AI credits per editor seat each month, and a trial gets 100 for the whole trial.
An answer costs by how many steps it took, never by the model behind it. Up to 10 steps cost 1 AI credit, 11 to 20 cost 2, more than 20 cost 3. If the model’s provider fails, the answer is free. A small ring next to Send shows what is left, and each answer shows what it cost.
AI credits are separate from the credits that tool and workflow runs, downloads and exports use. Answers from an organization’s own AI connection never use AI credits, and self-hosted GOAT has no limit.
To see all of this in one place, Settings > Usage has been rebuilt. It shows five tiles: Credits, AI credits, Storage, Projects and Editors. Each opens its own detail. Credits and AI credits break down by date range and by member, and Storage shows what takes up the space, the trash included.
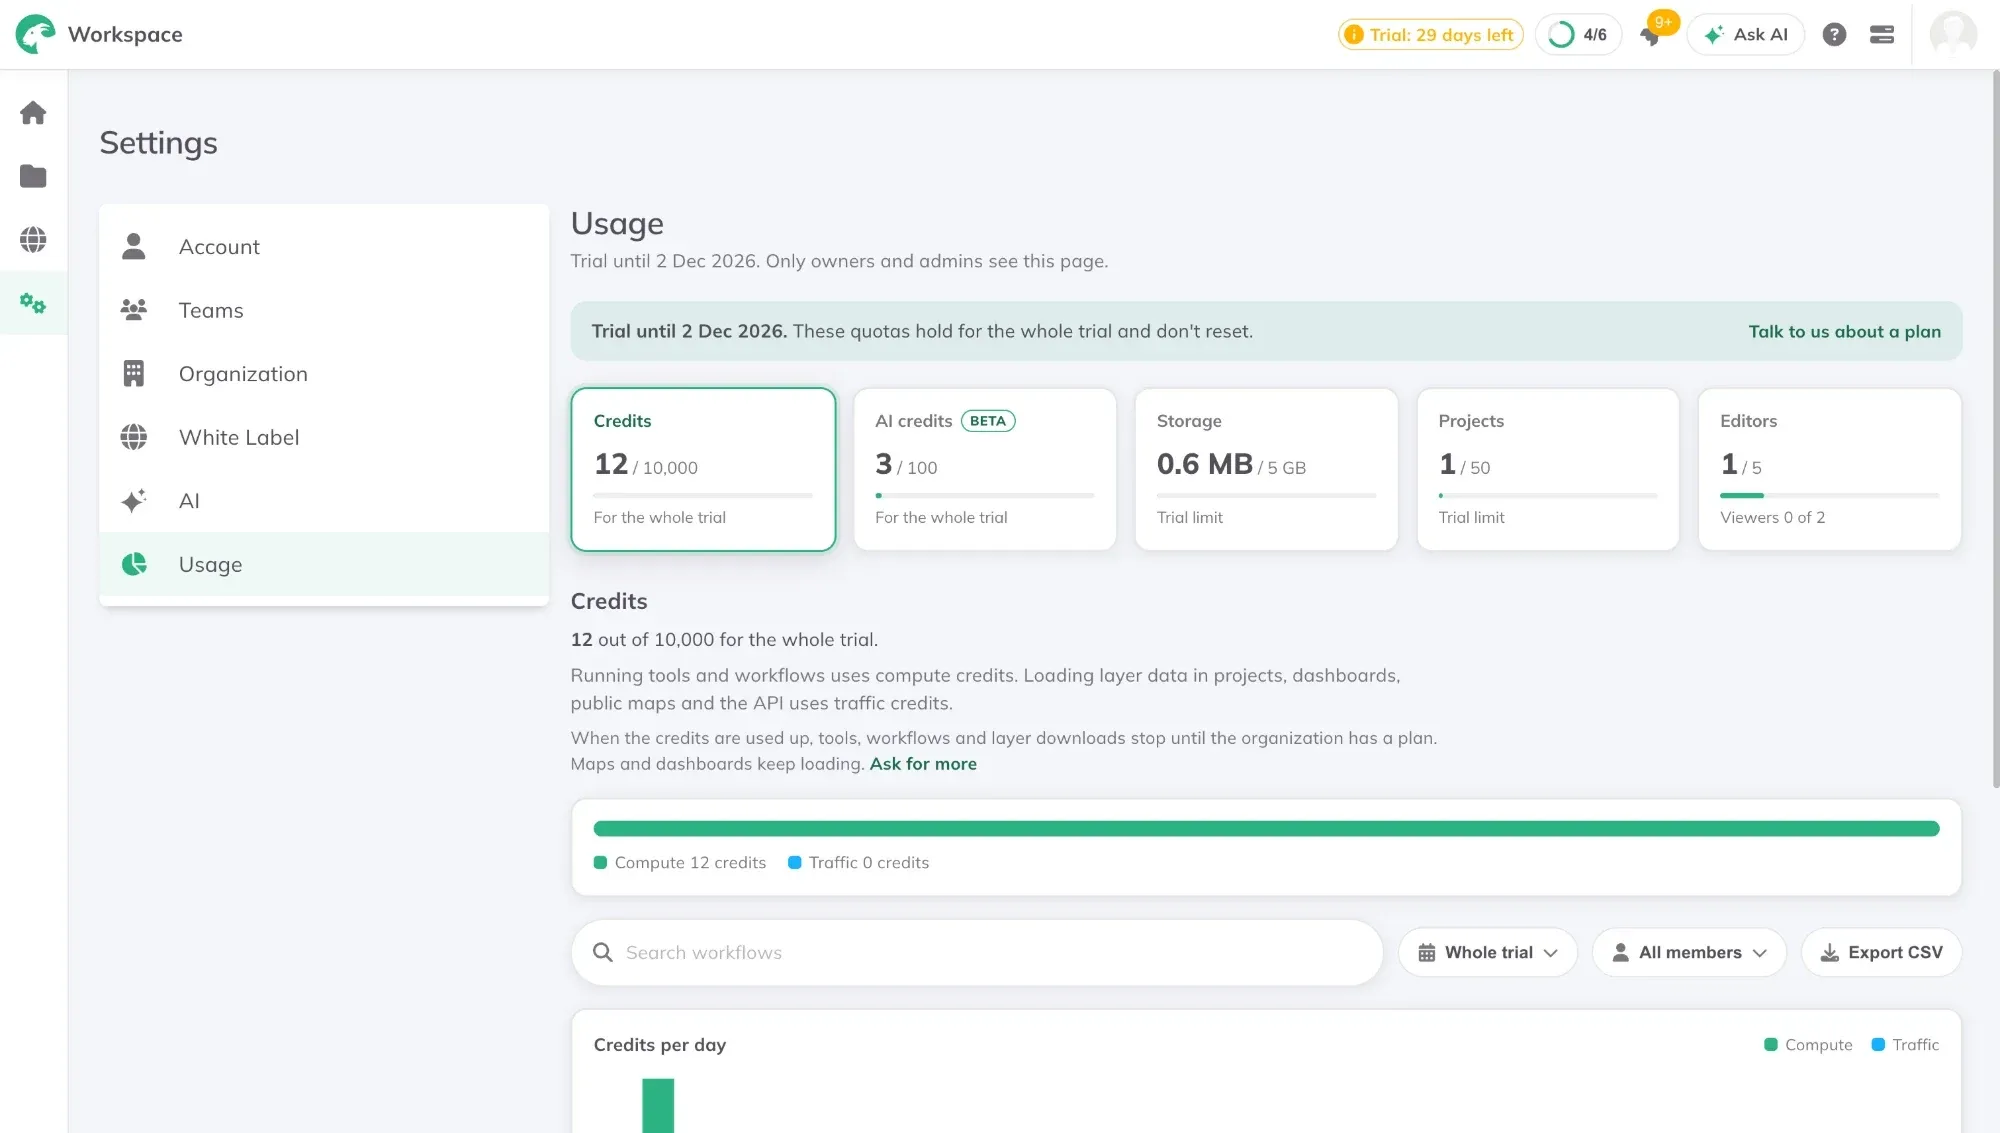
Settings > Usage: one tile for each quota, with its detail below.
3. PT Network Explorer: read a GTFS feed on the map
Since 3.0 you can bring your own public transport network as a GTFS feed. Until now you could run indicators on it, but not easily look inside it. A GTFS feed is a set of tables of stops, trips and stop times, and reading a network from those tables is slow work.
The Explorer shows the feed the way planners and riders think of it. Open the bundle’s menu, choose Explorer, and the network is drawn on the map with every line in its own colour.
- Lines: headways per time period, vehicles in service through the day, running times and the span of service.
- Stations: the timetable per line and direction, and the next departures from any stop.
- Trips: every trip stop by stop, with the trips before and after it.
- Calendar: on which days the line runs, its day types and its exceptions.
Yes, it can be overwhelming at first. The amount of information in a GTFS feed is huge. So relax, and take your time to explore it.
A bar at the bottom plays the network through the day, with vehicles moving on the map. Select a line and the bar grows into a time-distance chart of all its trips.
There is also a cost estimate. The Explorer counts vehicle-kilometres and vehicle-hours from the timetable and prices them at European average rates, for the whole network, one line or one trip. The rates are adjustable per agency and vehicle type.
And it is fast. GOAT prepares a snapshot of the feed once per version and loads it into the browser, so the Explorer answers without a round trip per question.
Barcelona’s network in the Explorer, from import to playback.
4. ÖV-Güteklassen along the street network
ÖV-Güteklassen grade how well a place is served by public transport, by distance to a station and how often it is served. Until now GOAT drew those distances as circles around each station.
Circles are generous. A river, a railway line or a dead end does not stop a circle, but it stops someone walking to the stop. In 3.1 you can let the class distances be walked along the street network instead, so places you cannot actually reach on foot no longer count as served.
The circles stay available next to it. For the network, GOAT uses the one you pick, else the one linked to the PT bundle, else its default.
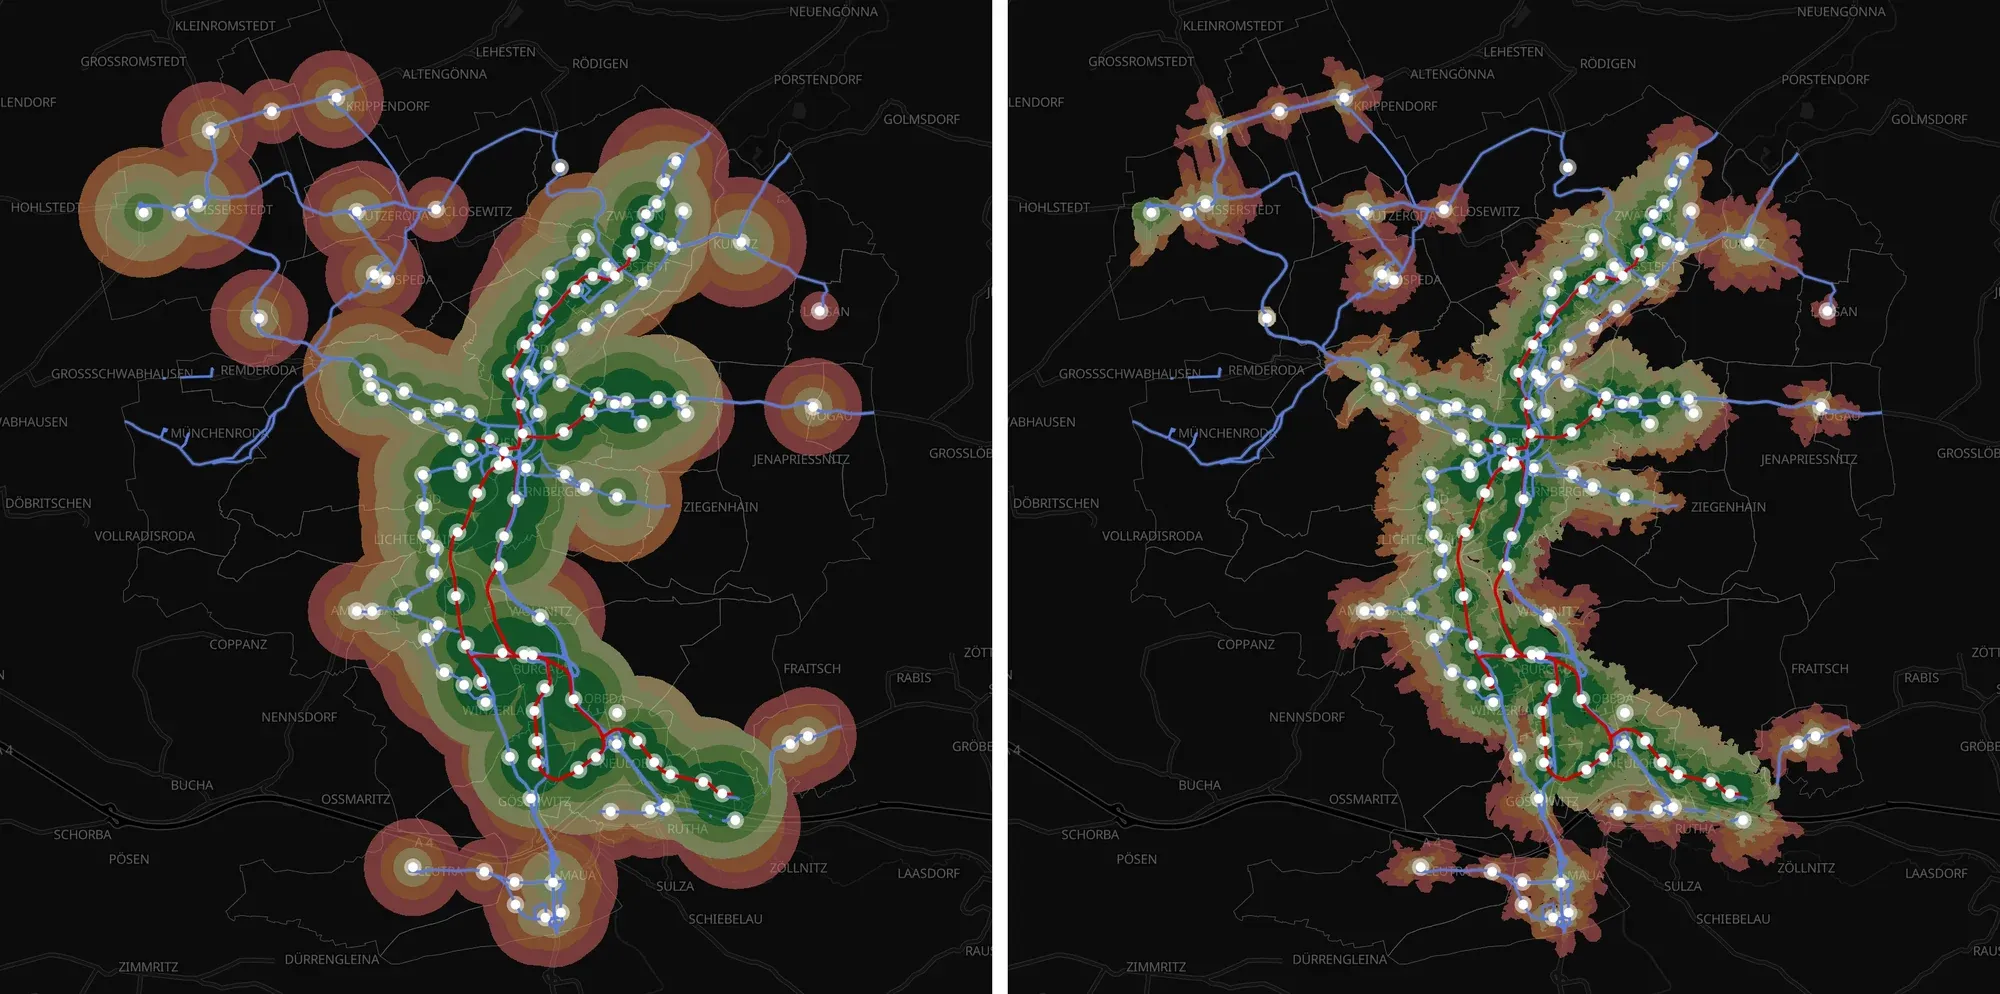
Jena, the same classes as circles (left) and along the street network (right).
5. Dashboards: layer switchers and duplicate widgets
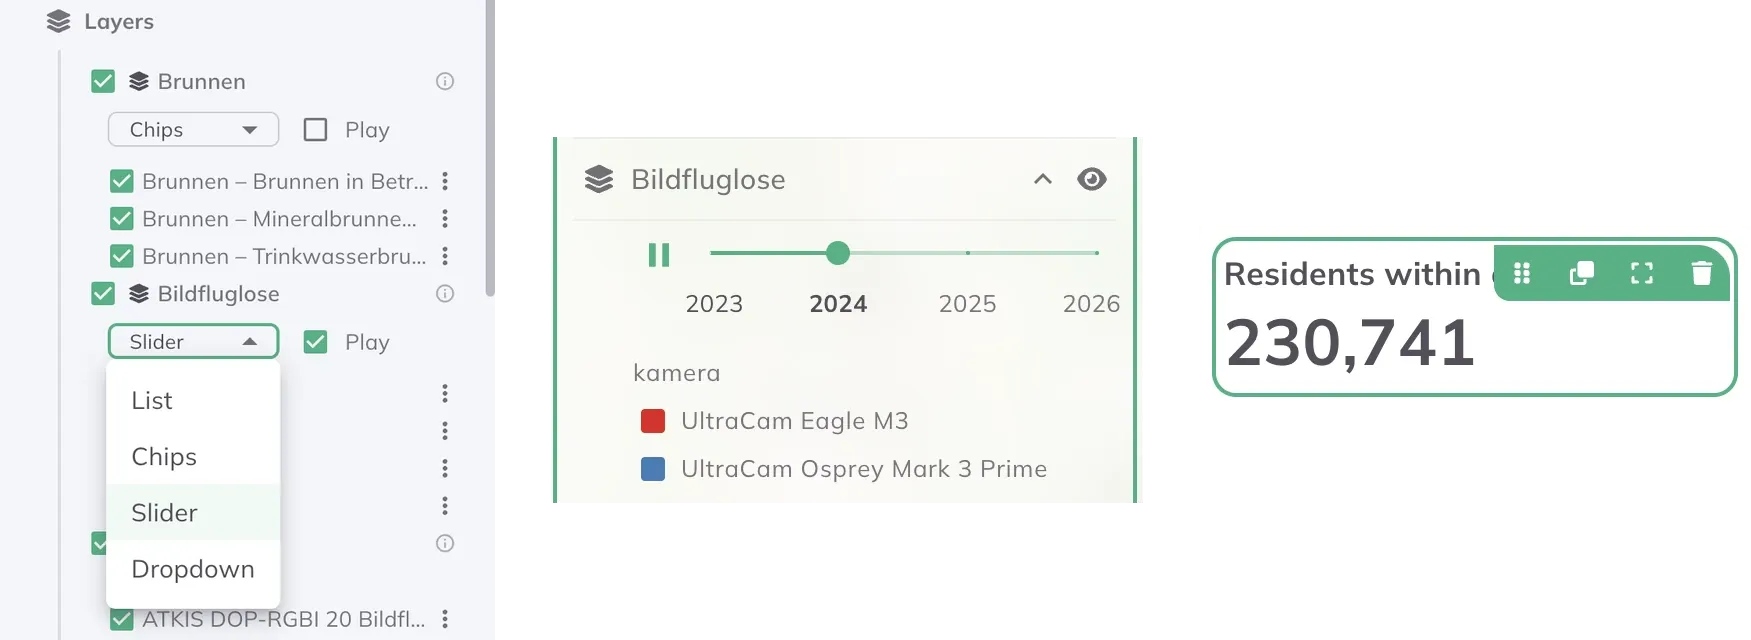
A layer group as a slider with Play, the result in the dashboard, and the toolbar to duplicate a widget.
A dashboard often needs to show the same area several ways: travel times by mode, a scenario before and after, a year by year series. Until now each was another layer stacked on the map.
A layer group in the Layers widget can now show one layer at a time, as chips, a slider or a dropdown. An optional play button steps through them, and the legend follows the layer on the map. Viewers of a published dashboard always see exactly one layer of such a group.
Building dashboards got faster too. A widget can be duplicated with its settings in one click, and a Tabs widget is copied with the widgets inside it. Filters keep their state when you switch tabs.
6. Smaller changes you will maybe skip
Trials that tell you where you stand. A new organization starts a trial, the trial chip shows the days left, and GOAT warns before it ends. An organization out of credits can still open maps and tables; new runs and downloads wait until credits are added.
One language everywhere. The language you choose in GOAT now also applies to the sign-in pages and to every email we send to you.
Fixes. Catalog layers can be renamed, with names up to 255 characters. A newly imported dataset now appears on Home as soon as the import finishes.
This post covers the highlights. For every change in 3.1, big and small, see the changelog or the full release notes on GitHub.
Why 3.1 matters for planning
With 3.0 the data was there and the project could start from a template. What was left was the analysis itself: knowing which tools to chain, in which order, with which settings.
3.1 takes on that step. You describe the question, and the assistant proposes the workflow, runs it and shows its steps, so you can check every number. The Explorer and the street-network ÖV-Güteklassen do the same for public transport: less time reading tables, more realistic results.
None of it replaces planning judgement. It makes the distance between a question and a first answer shorter.
Getting started
GOAT 3.1 is available now. There is nothing to install: GOAT runs in the browser, so existing users see 3.1 the next time they open the app. Admins find the AI switch and the data policy under Settings > AI. If you are not using GOAT yet, GOAT is free to start.
Frequently asked questions
What is GOAT AI?
GOAT AI is the assistant built into GOAT. You ask it in your own words to find projects and datasets, explain what a layer contains, compute statistics, or build and run an analysis as a workflow. It works with your own GOAT permissions.
Where is GOAT AI hosted?
GOAT AI, the connection included with GOAT, runs on a model hosted in the EU. Organizations can use a connection of their own instead, with their own provider and key.
Does GOAT AI see my data?
Only what your organization allows. Under the Standard data policy, the model sees what a member can see. Under Restricted, it sees only field names, types, counts and statistics, never single rows or geometries.
How much does GOAT AI cost?
Answers use AI credits. With the standard terms, a subscription gets 200 AI credits per editor seat each month and a trial gets 100. An answer costs 1 to 3 AI credits, depending on how many steps it took.
What is the PT Network Explorer?
A view that opens a GTFS public transport feed on the map: its lines, stations, timetables and calendar, a playback of its vehicles through the day, and an estimate of its yearly operating cost.
How do I upgrade to GOAT 3.1?
There is nothing to install. GOAT runs in the browser, so existing users see version 3.1 the next time they open the app.