
Five months to the new VerkehrsInfo BW, and the years of work that made it possible
Baden-Württemberg spent years making its mobility data open and standardised. Its new web platform, VerkehrsInfo BW, took five months. That order of events is the whole story of this project.


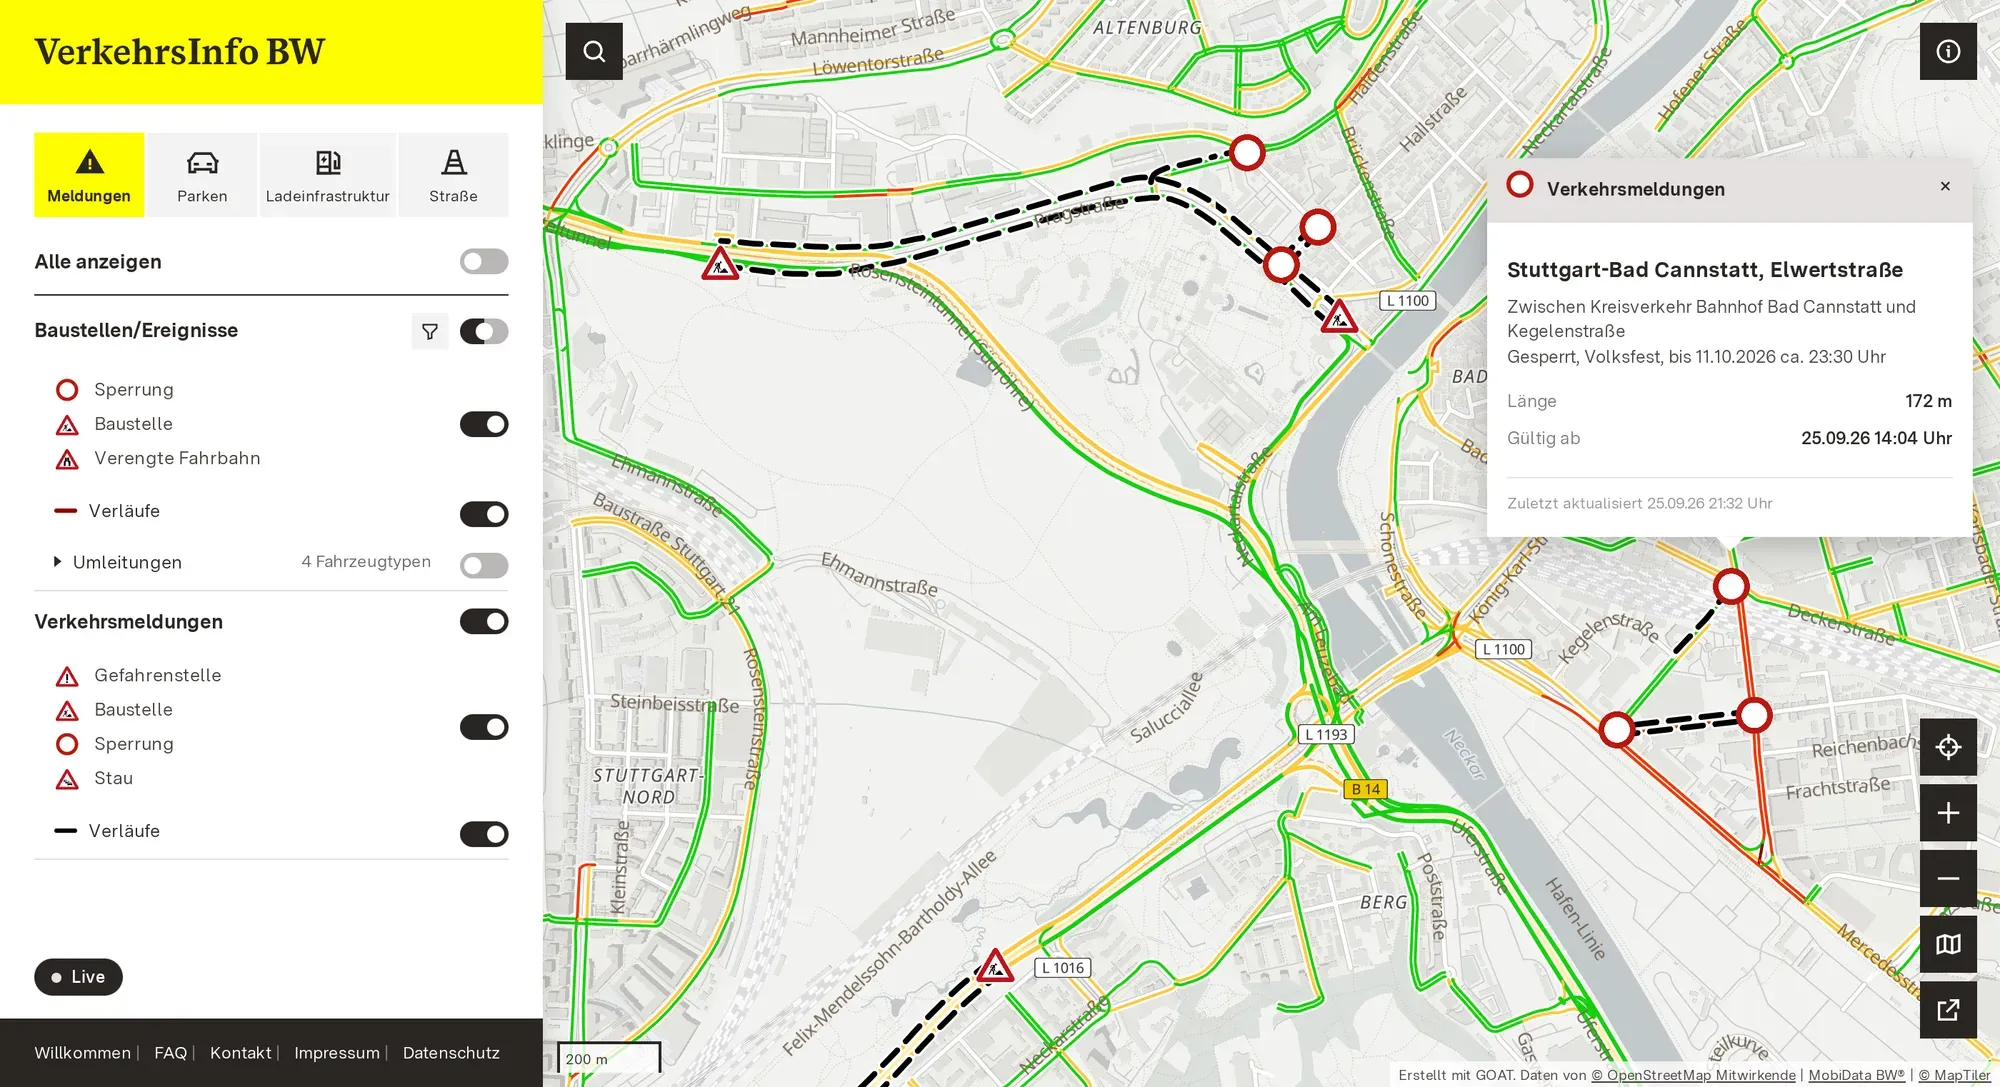
When we started talking with NVBW in March, we expected the hard part to be the data. It usually is. You spend weeks finding out who holds what, in which format, how often it is updated, and whether you are allowed to show it.
This time, much of that work was already done. NVBW runs the data portal MobiData BW, and over the years it had built up a real treasure of data there: roadworks, truck parking, charging points, park-and-ride sites and real-time transit departures, standardised and openly published. We connected further sources during the project, but the foundation was already there.
How to show the data was not a new question either. VerkehrsInfo BW, a service of the Ministry of Transport, already had a website. Most German states run something like this, and we studied the ones in Hamburg and Bavaria carefully before we designed ours. A state traffic information service is not a novelty. It is a standard piece of public infrastructure.
NVBW wanted a new web platform on current technology: easier to maintain and extend, open source so that the state does not depend on one supplier, and consistent with the state’s corporate design. The old platform was planned to be switched off at the end of June 2026, and the new one was meant to be ready by then.
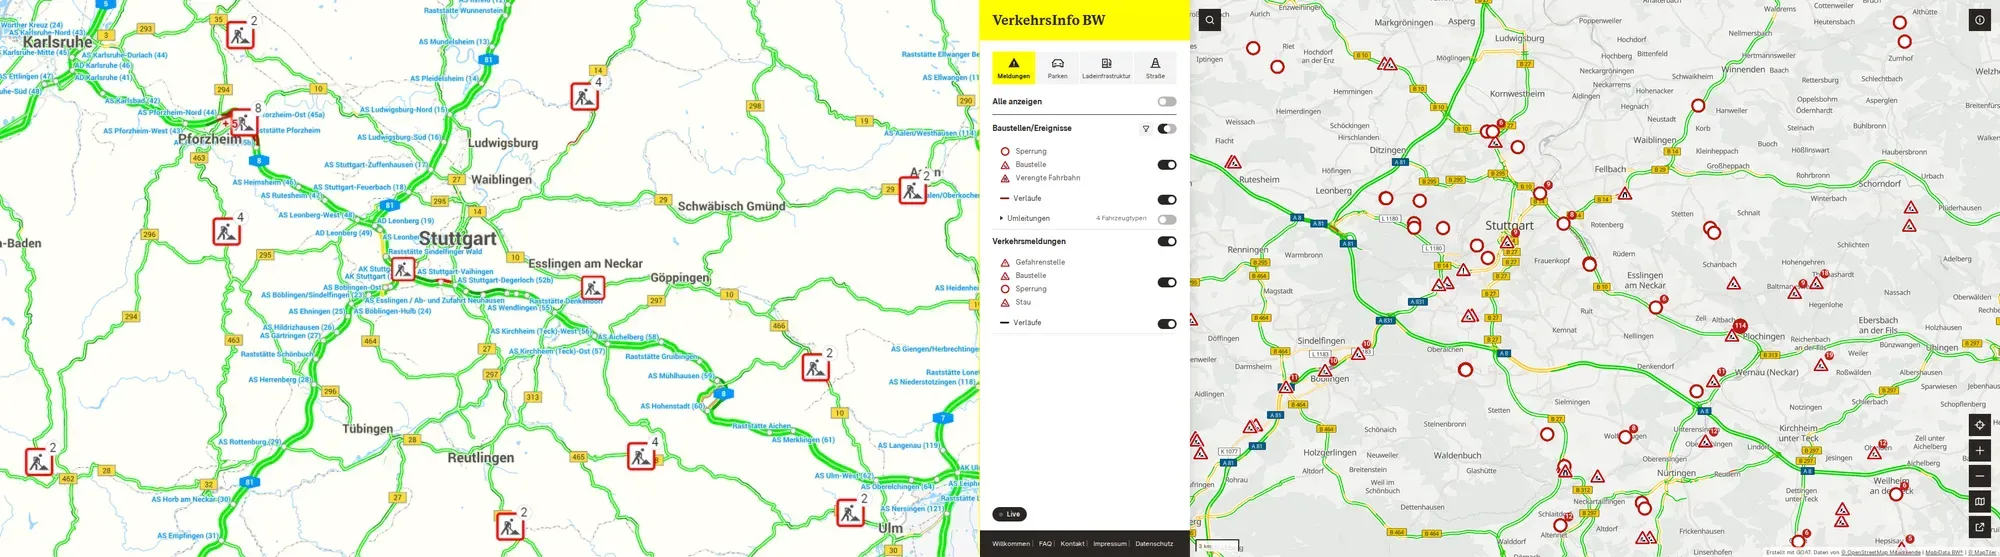
The previous website on the left, VerkehrsInfo BW in October 2026 on the right.
1. The work in the background
MobiData BW is Baden-Württemberg’s central mobility data portal, run by NVBW on behalf of the Ministry of Transport. Municipalities and commercial providers deliver their data through their own interfaces and in their own formats. MobiData BW bundles it and converts it into agreed standards, roadworks for example into DATEX II. From there, the data goes on to the Mobilithek, the national access point, which is how municipalities and operators meet their obligations under the EU ITS Directive.
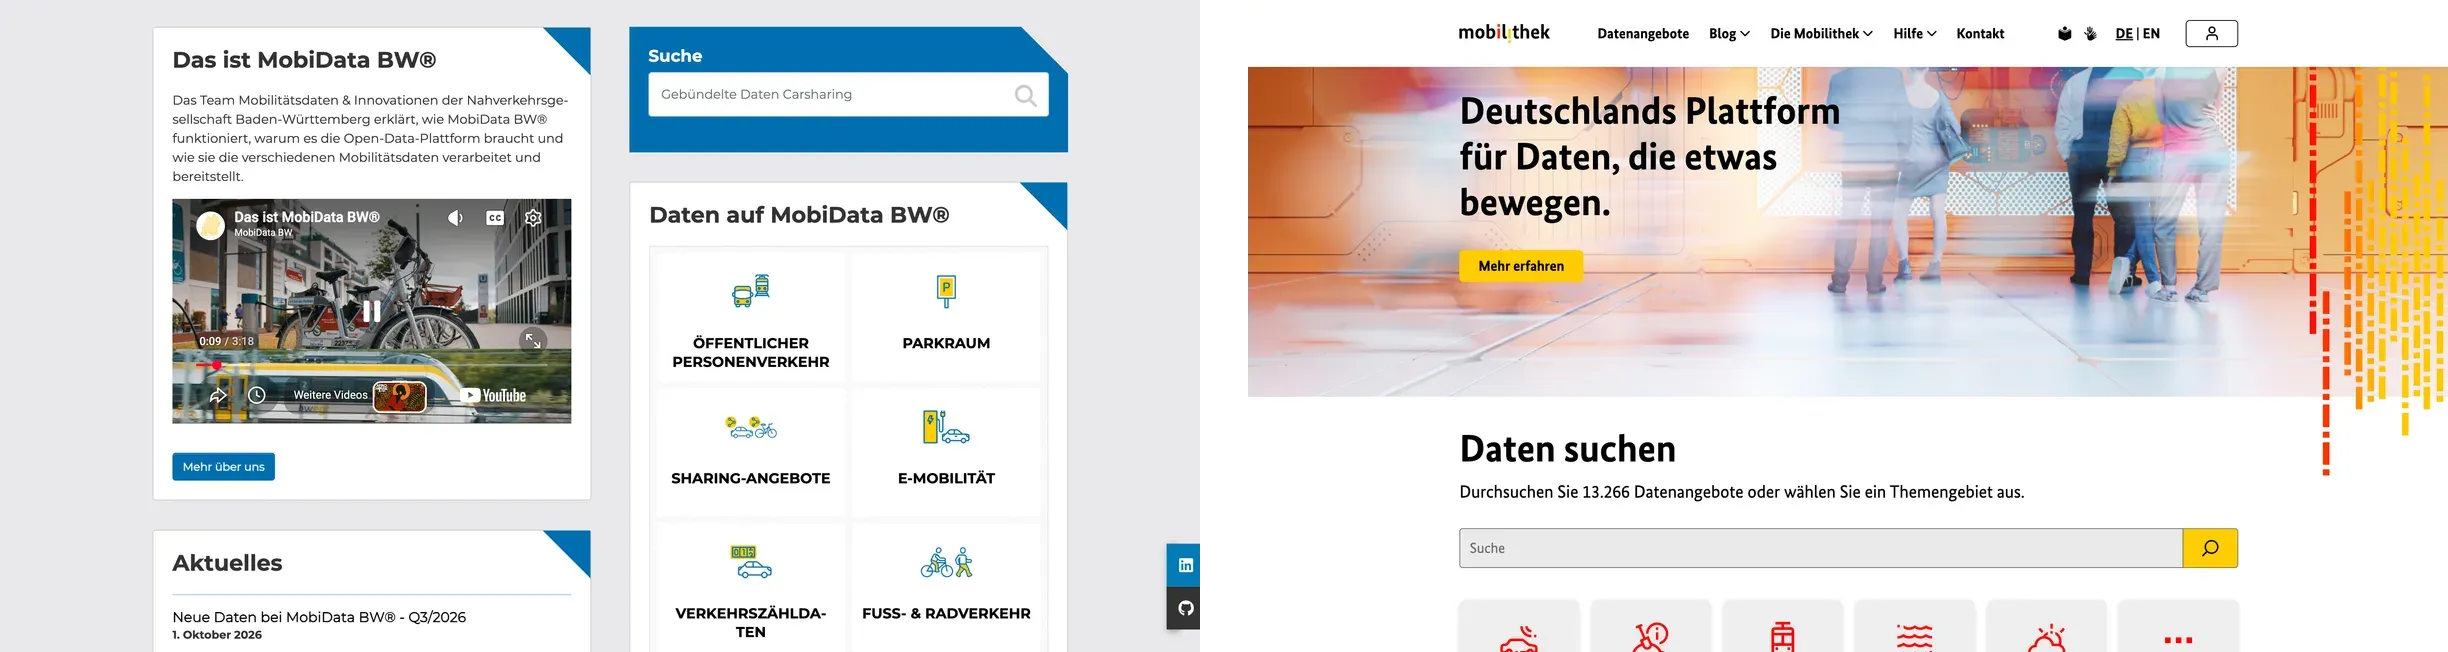
MobiData BW on the left, the Mobilithek, the national access point, on the right.
2. An API is not a map
Open data works very well for one group: logistics companies, engineering offices, research institutes, app developers like us. They take the feeds and build what they need on top of them. Everyone else already has a navigation app for getting from A to B, and VerkehrsInfo BW is not trying to replace it.
VerkehrsInfo BW offers something else: the official picture, from the body that is responsible for it. The roads the state maintains, not only the motorways. Its park-and-ride sites, truck parking, charging stations, road weather and bridges. Complete for Baden-Württemberg, free, and directly from the source.
The API user wants the full record in a predictable structure. The person checking something before leaving wants one view that answers one question, on a phone, in a car park, at six in the morning. That second view was our task. It is often underestimated, because from the outside it looks easy.
3. Who it is for
So we started with people, not technology. Who is going to use VerkehrsInfo BW, and what for? We developed a persona for each target group, and in a three-hour workshop with NVBW we followed each one through the application, step by step. Some were easy to predict: a commuter checking her usual route before she leaves, or someone looking for an accessible parking space who needs the information to be exactly right.
Two were not. A traffic police officer who checks whether the incident he has just entered has reached the public map. And a dispatcher at a logistics company, who plans his routes in his own software. He uses VerkehrsInfo BW for information his software does not have, for example restrictions on bridges. When he needs it regularly, he pulls the same data from MobiData BW straight into his own systems. For him, the platform has done its job when he no longer needs to open it.
4. How it is built
VerkehrsInfo BW has three layers: the data sources, GOAT in the middle, and the web app in the browser. Most of the data comes from MobiData BW: roadworks, traffic reports and diversions as DATEX II, charging stations through OCPI, parking through MobiData BW’s parking API. Further public and commercial sources add what MobiData BW does not carry, such as road weather and traffic flow.
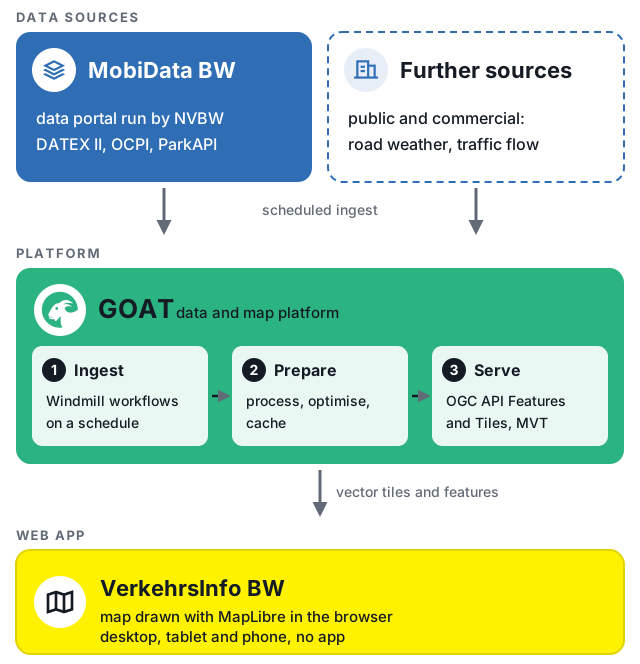
From the data sources through GOAT to the web app.
GOAT does three things in between. Scheduled workflows in Windmill, the workflow engine behind GOAT, fetch each source at its own interval, from every minute for parking to once a day for data that rarely changes. GOAT processes and optimises the data and keeps it in a cache. And it serves it to the frontend through the open standards OGC API Features and OGC API Tiles, as vector tiles (Mapbox Vector Tiles) that MapLibre draws very quickly in the browser.
So when you open the map, the platform does not send a request to the parking API or the weather stations. It reads data that is already prepared. That is why it is fast, and why a slow source does not slow down the map.
5. Four design decisions
The colours, the logo and the typefaces come from the state’s design manual. Within that framework, we made four decisions.
The icons. The state’s own iconography was hard to read at map sizes, so we chose simple icons derived from road signs. People already know what they mean. There is no standard sign for bridges or road weather, so we designed those two together, so that they work side by side on the same map. After the launch, at the ministry’s request, the bridge icon got a new inner symbol that is easier to recognise at first glance. Colour and size stayed the same.

Road signs people already know, plus the yellow badges for bridges and road weather.
The colours. We started from the state palette, but it was not enough. We needed five colours for parking availability that people can tell apart at a glance, and several of the original ones could not be told apart by colour blind users or did not reach the contrast WCAG asks for. So we tested and adjusted them until they did. The result is still clearly the state’s palette.

Five availability states, adjusted until colour blind readers can tell them apart.
The traffic layer raised the same question again, with four levels from standing to free-flowing traffic. Those colours have to be read correctly on a moving map, in a car, in daylight.
The zoom levels. Zoomed out, you want an overview of the whole state. Zoomed in, you want every street. So the detail appears as you zoom in. Roadworks work the same way: from far away, a point shows that something is happening. Closer in, it becomes a line along the affected stretch, so you can see which part is closed.
The basemap was the easiest decision, and the one we would defend most strongly. We took the basemap NVBW already had and adjusted it only so that it stays quiet in the background. A basemap that is interesting to look at competes with the data on top of it.
6. No app, on purpose
VerkehrsInfo BW went live on 23 July 2026, before the summer holidays. That was a little later than planned, because we were still waiting for the servers and there were last changes. It runs entirely in the browser, on phones, tablets and desktop computers.
Everyone who opens it is on the current version. A new feature reaches every user at once, without waiting for two app stores or for people to update their apps. A state runs a service like this for many years. How updates reach people is part of the running costs, not just a technical detail.
7. Since launch
VerkehrsInfo BW did not have every possible feature on its first day, and it was not meant to. First, the new platform had to do everything the old one did. Since then it has grown in small steps, with the features its users ask for, and more will follow. A platform like this is never finished, and it is not supposed to be. That is how we like to work at Plan4Better: agile and close to the people who use the software.
The clearest example is the interface itself. On 7 October 2026, a fully custom interface went live: its own frontend in the state’s design, drawing the map with MapLibre directly. It brings together what was added after the launch: diversions with arrows for their direction, a roadworks filter by road, place, type and period with CSV export, a measure highlighted together with its diversions, travel-time losses in minutes, and an address search.
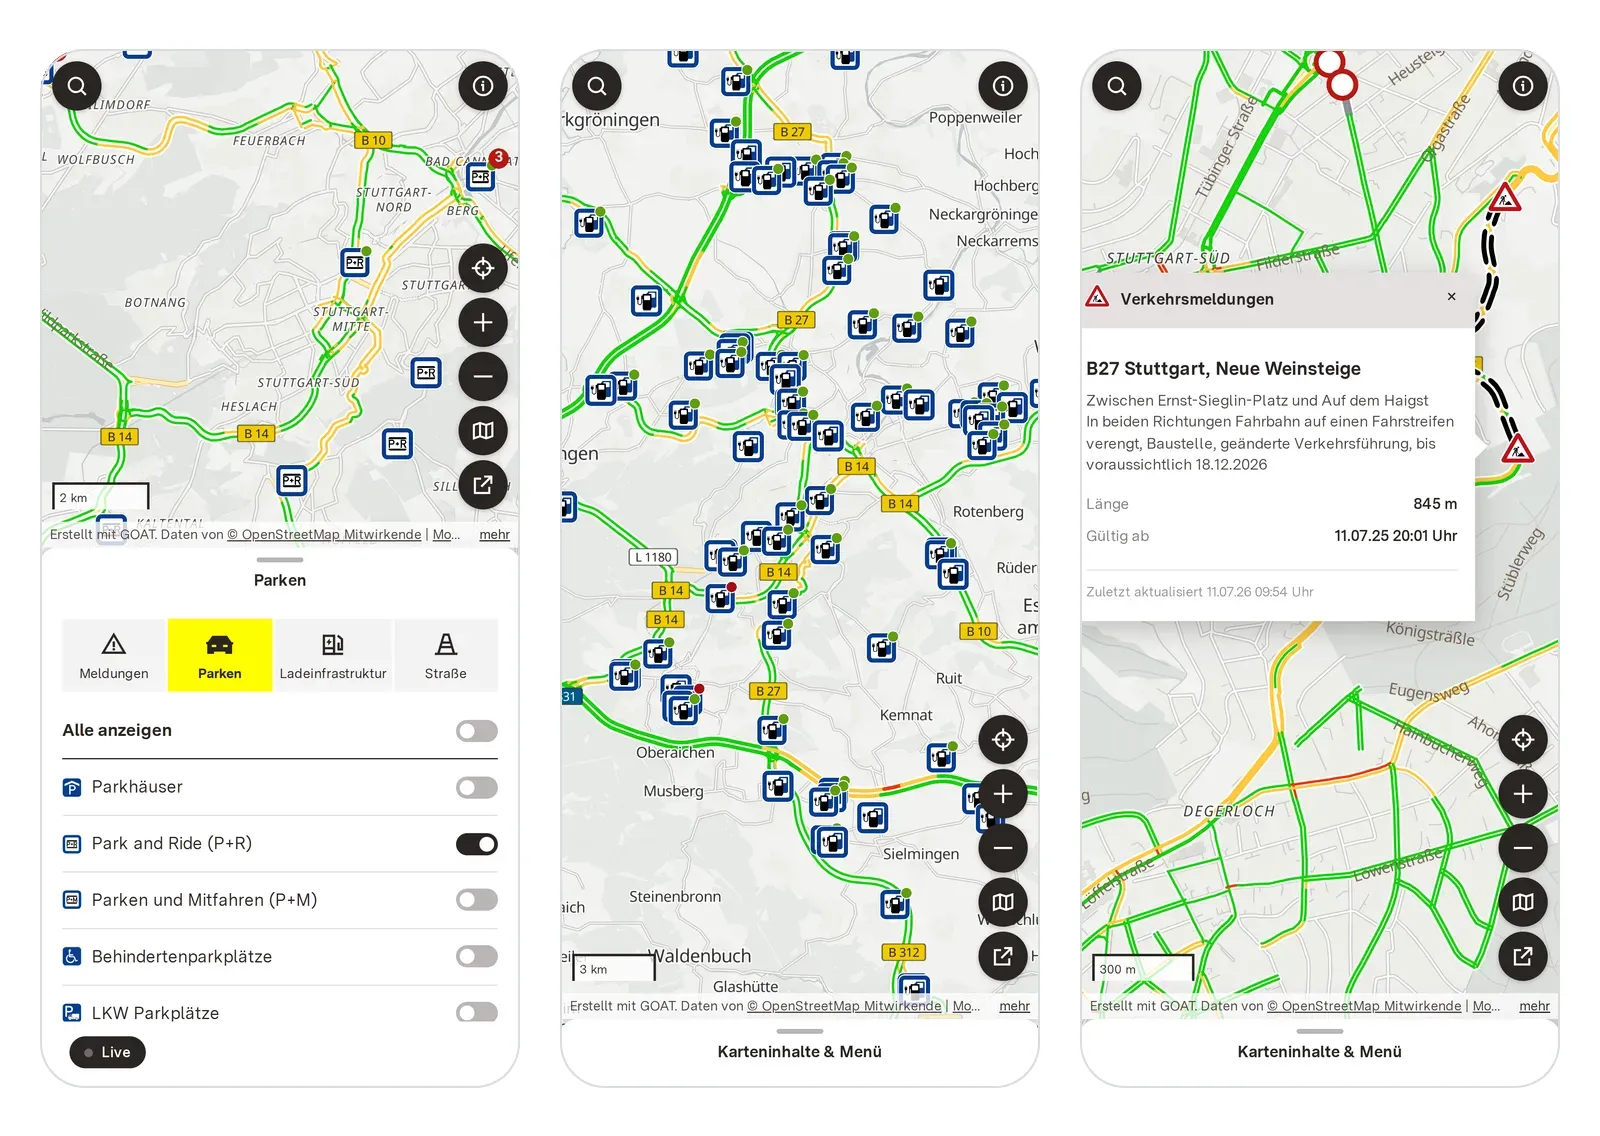
VerkehrsInfo BW in October 2026 on a phone, in the browser, with nothing to install.
8. Five months
First conversations in March, live on 23 July. This was not because the work was small. It was because large parts of two of the three layers already existed: NVBW’s data, standardised and published for years, and GOAT, built to bring together geospatial and mobility data. What had to be made for this project were the additional sources, the themes, the interface and the testing, and a lot of back and forth until everything was right.
Whether this was cheaper than another approach, we cannot prove, so we do not claim it.
What we will say is that the parts we built are open source and go into GOAT’s main repository, and that the whole thing runs on open standards and open map tooling rather than on a licence. The web platform itself is the ordinary part. How it is built is what we find worth discussing.
What stays with us
The case for open data is usually made for the benefit of others. Publish your data, and researchers will study it, companies will build on it, citizens will hold you to account. All true, and all about other people.
This project shows another side. Baden-Württemberg standardised its mobility data so that others could use it. In the end, the state itself benefited first: it could rebuild its own public service in five months.
It makes us wonder how many public bodies have data they see as something to give away. That same data could be the foundation for what they want to build themselves next year.
References
- MobiData BW, about the platform. Operated by NVBW, cross-modal mobility data as open data.
- MERIDIAN, T5.01 MobiData BW. On standardisation as the platform’s core function, and the link to the Mobilithek and the ITS Directive.
- Ministry of Transport Baden-Württemberg, press release of 23 July 2026 on the new VerkehrsInfo BW.
- MobiData BW, roadworks dataset for Baden-Württemberg, in DATEX II.
Frequently asked questions
What is VerkehrsInfo BW?
VerkehrsInfo BW is the state's web platform for traffic information, a service of the Ministry of Transport. It shows the current traffic situation, roadworks, parking, park-and-ride locations, truck parking and charging stations on a map, in real time and free of charge. The web platform went live on 23 July 2026 and works on phones, tablets and desktop computers without installing an app.
What is the difference between MobiData BW and VerkehrsInfo BW?
MobiData BW is the data portal run by NVBW. It gathers mobility data from state bodies, municipalities and private providers, standardises it, and publishes it openly through APIs. VerkehrsInfo BW is a public view of that data, for people who want a map rather than an interface. NVBW operates both, on behalf of the Ministry of Transport.
Where does the data come from?
Mostly from MobiData BW, which brings together data from road authorities, transit operators, and parking and charging providers. Further public and commercial sources, for example for road weather and traffic flow, were connected during the project.
Can I use the same data in my own application?
Yes. The data on MobiData BW is openly available, free and without discrimination between users. VerkehrsInfo BW is one application built on those feeds, not a restriction on them.
Could another region build something like this?
Yes, if its mobility data is already gathered and standardised. Then a web platform on top of it is a question of months. Otherwise, the data is where to start.
How long did it take to build?
About five months, from the first conversations in March 2026 to the launch on 23 July 2026. The plan was the end of June. The launch moved a little because the servers were not ready yet and there were last changes.
What does GOAT do in this project?
GOAT sits between the data sources and the web platform. It fetches the data on a schedule, processes and caches it, and serves it to the map. New datasets can then be configured instead of integrated from scratch each time.