
Newsletter4Better Summer 2026
New GOAT features, our project in Bonn, map-based dashboards as the topic of the month and our new industry pages. Plus an invitation to our booth at INTERGEO.
In the summer edition of our newsletter, we introduce new features of GOAT and talk about our most recent projects. This month’s topic is map-based dashboards for spatial planning, and on our new industry pages you can see how GOAT is used across different sectors.
We also would be delighted to welcome you at our booth (Hall B5 / M049) at INTERGEO in Munich from September 15th to 17th.
We hope you enjoy reading!
New in GOAT
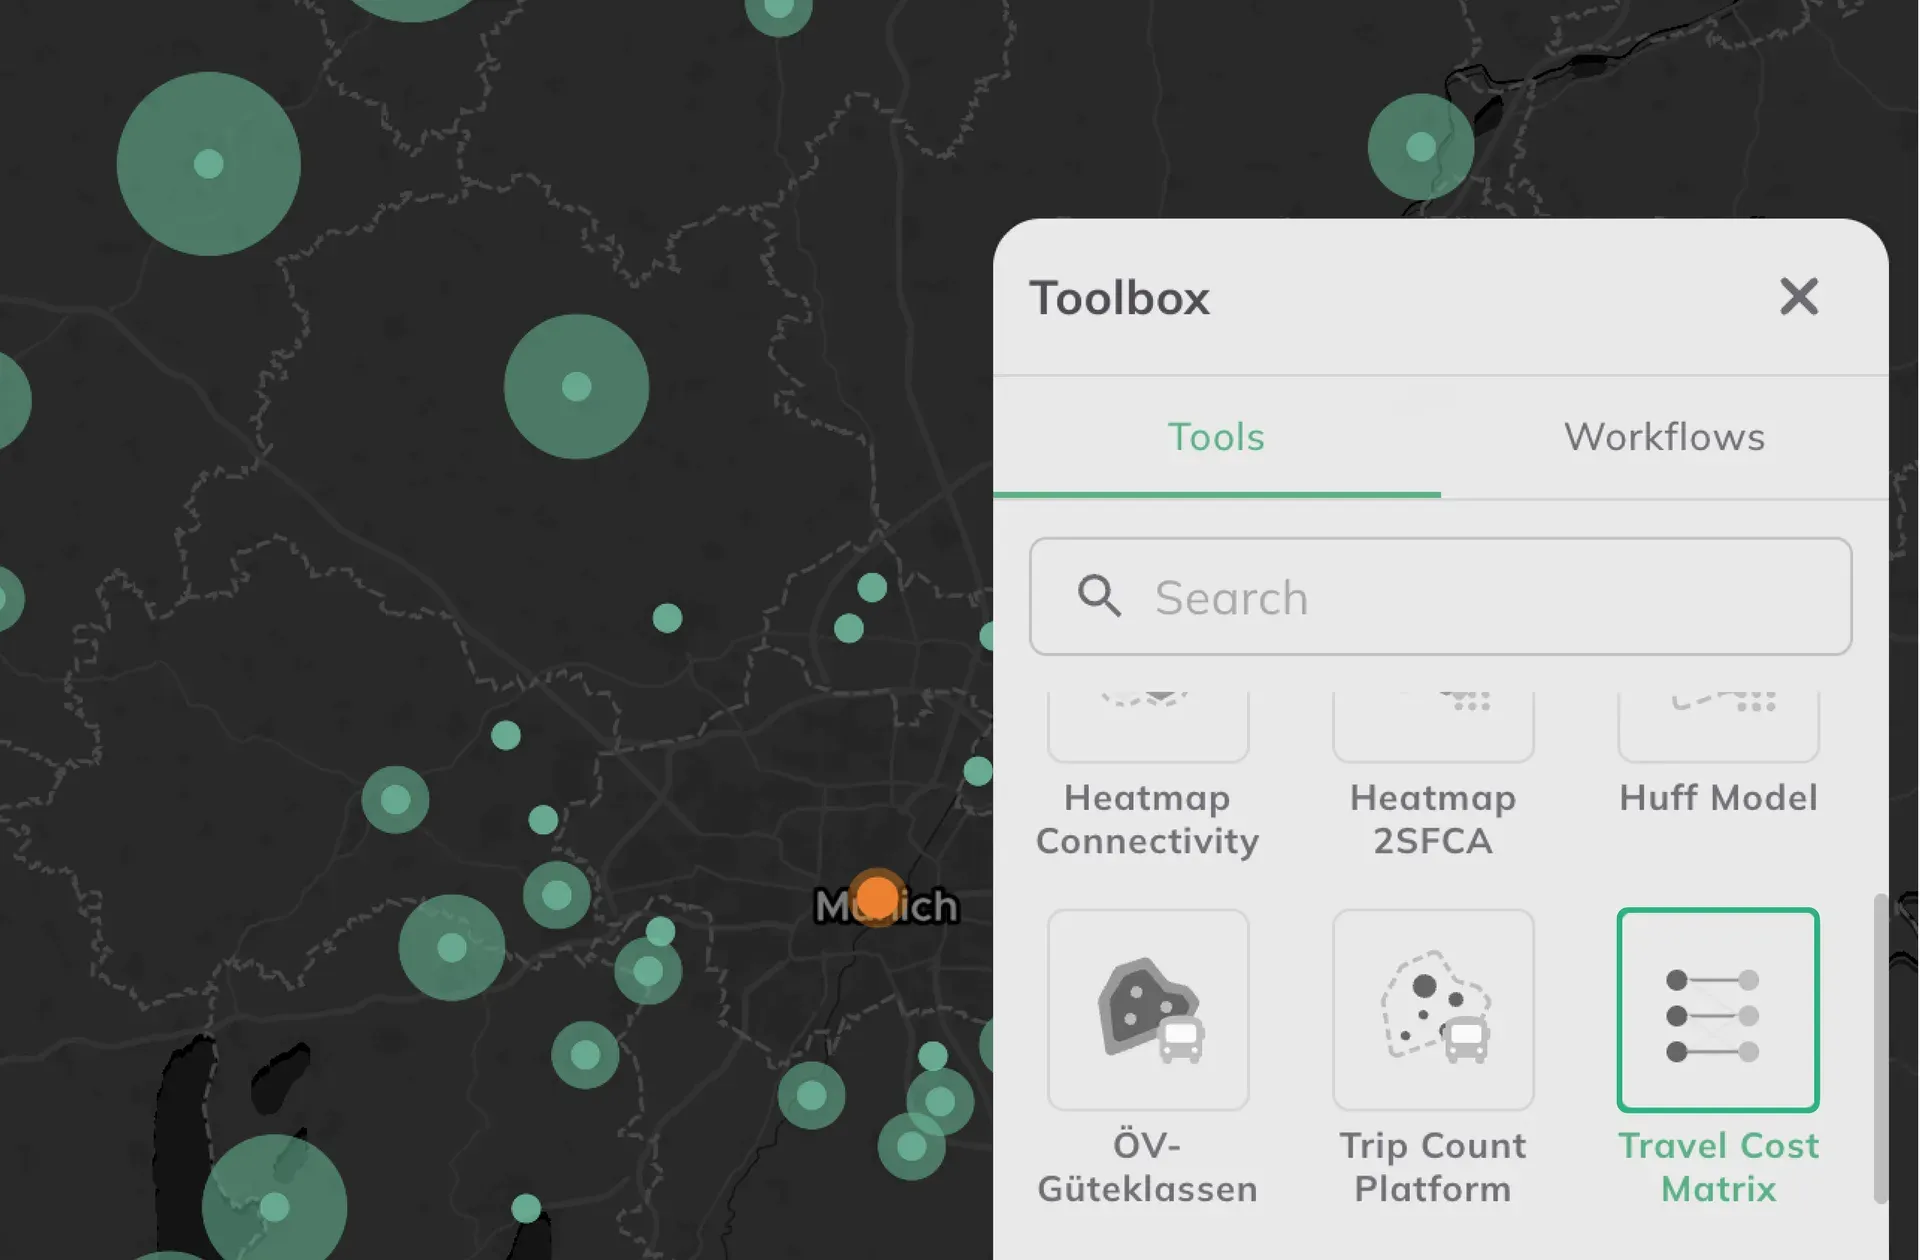
Explore the new GOAT features:
- A GIS workflow chains spatial analysis tools into one reusable pipeline. Learn more about the use of GIS workflows in GOAT here.
- This guide breaks down GOAT’s 8 tools for accessibility analyses.
- Design your own Pop-Ups with the Pop-Up Builder.
- Calculate travel time or distance between a set of origins and a set of destinations with the Travel Cost Matrix tool.
New projects
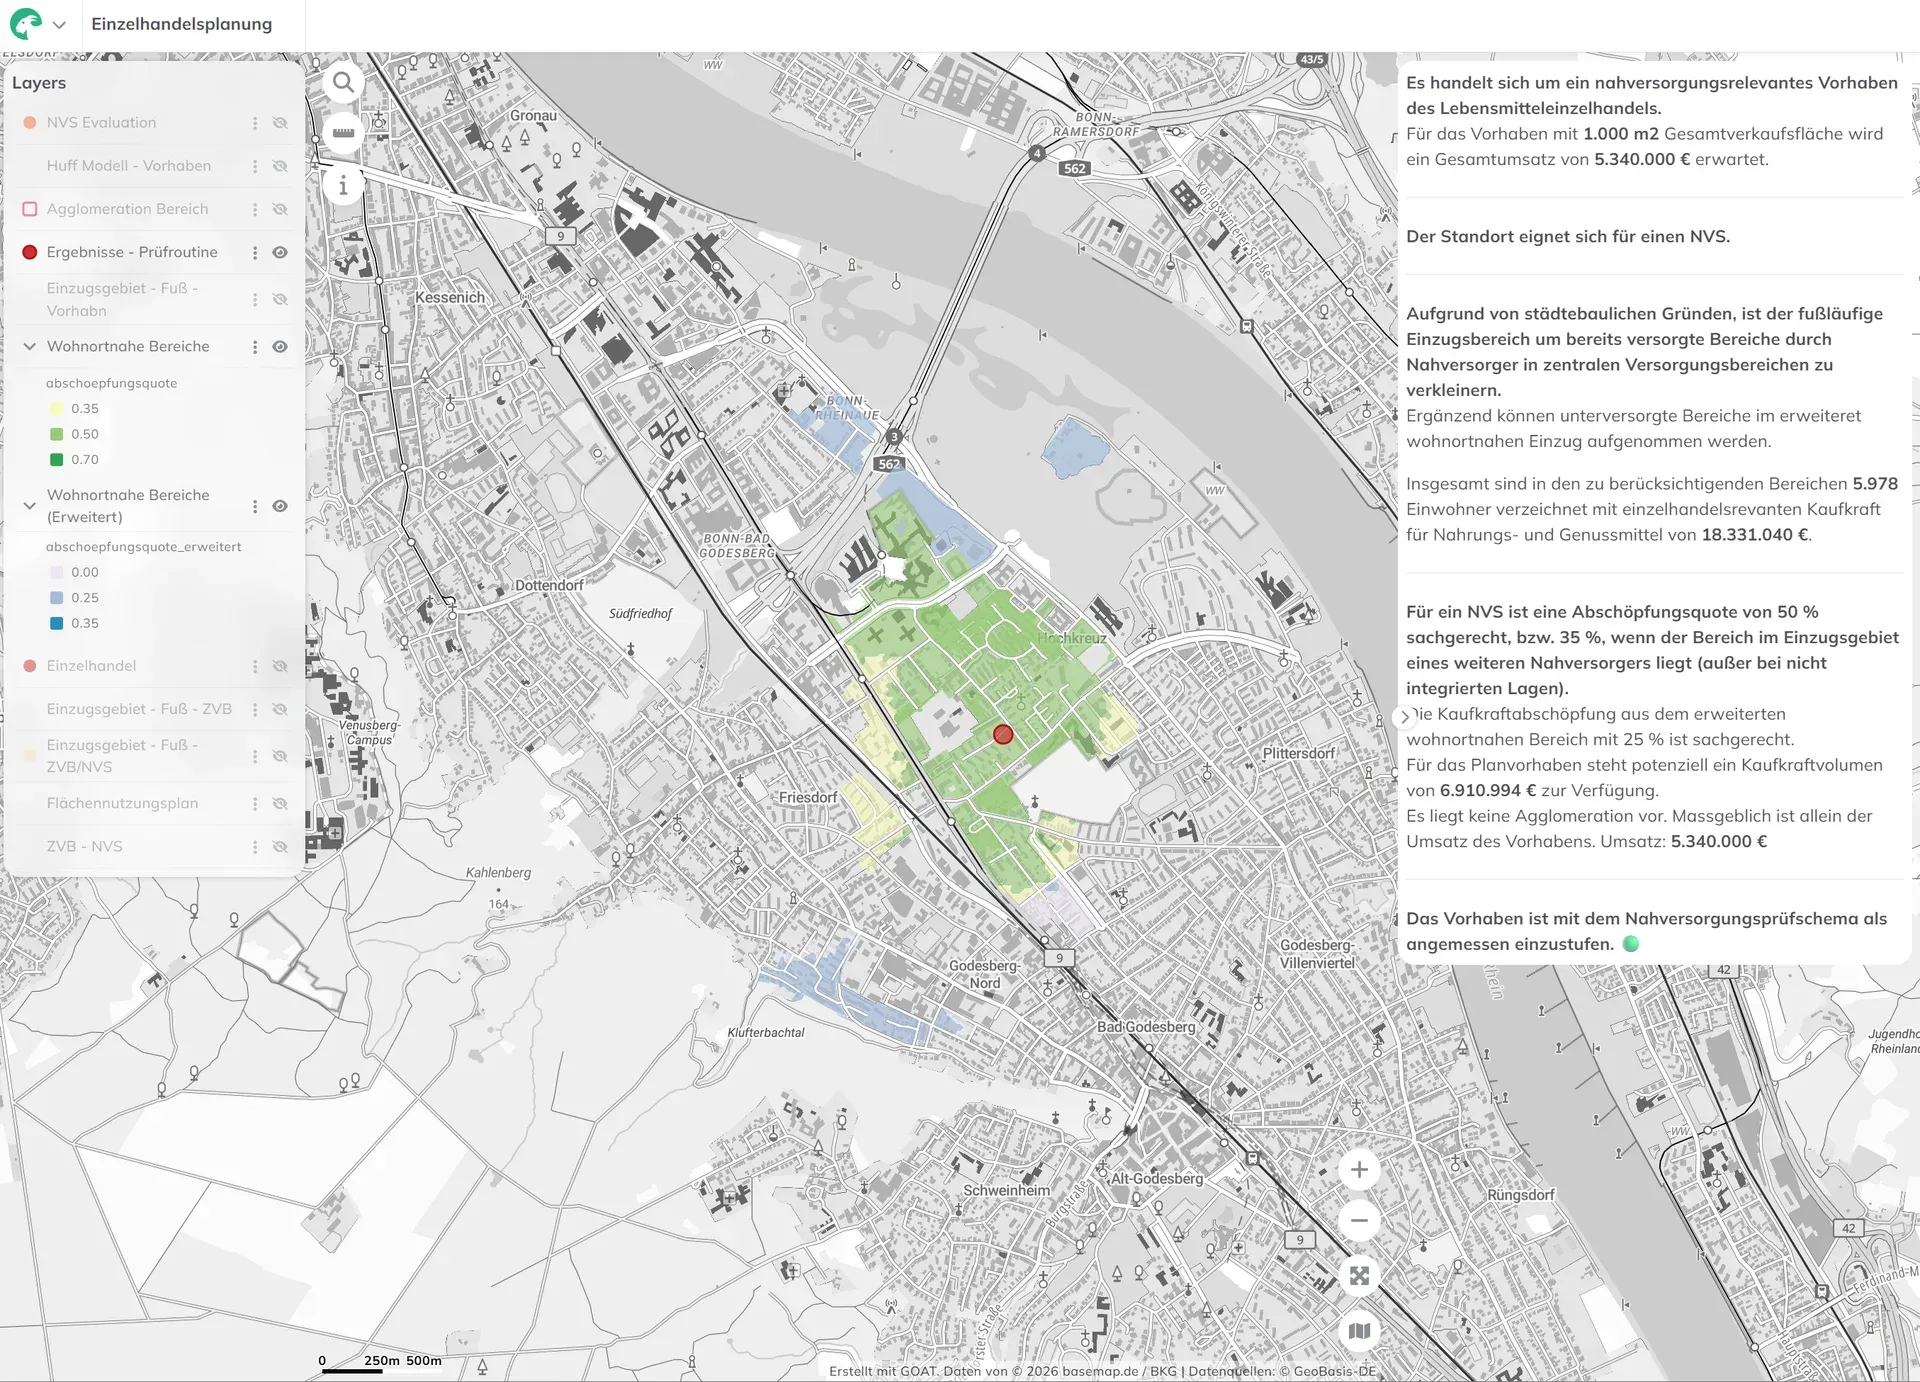
Retail planning in Bonn: data-based GIS analysis with the WebGIS GOAT
Plan4Better is developing a GIS-based retail planning tool for the City of Bonn — enabling automated accessibility analyses, local supply assessments, and data-driven decisions fully integrated into the Urban Data Platform.
Topic of the month
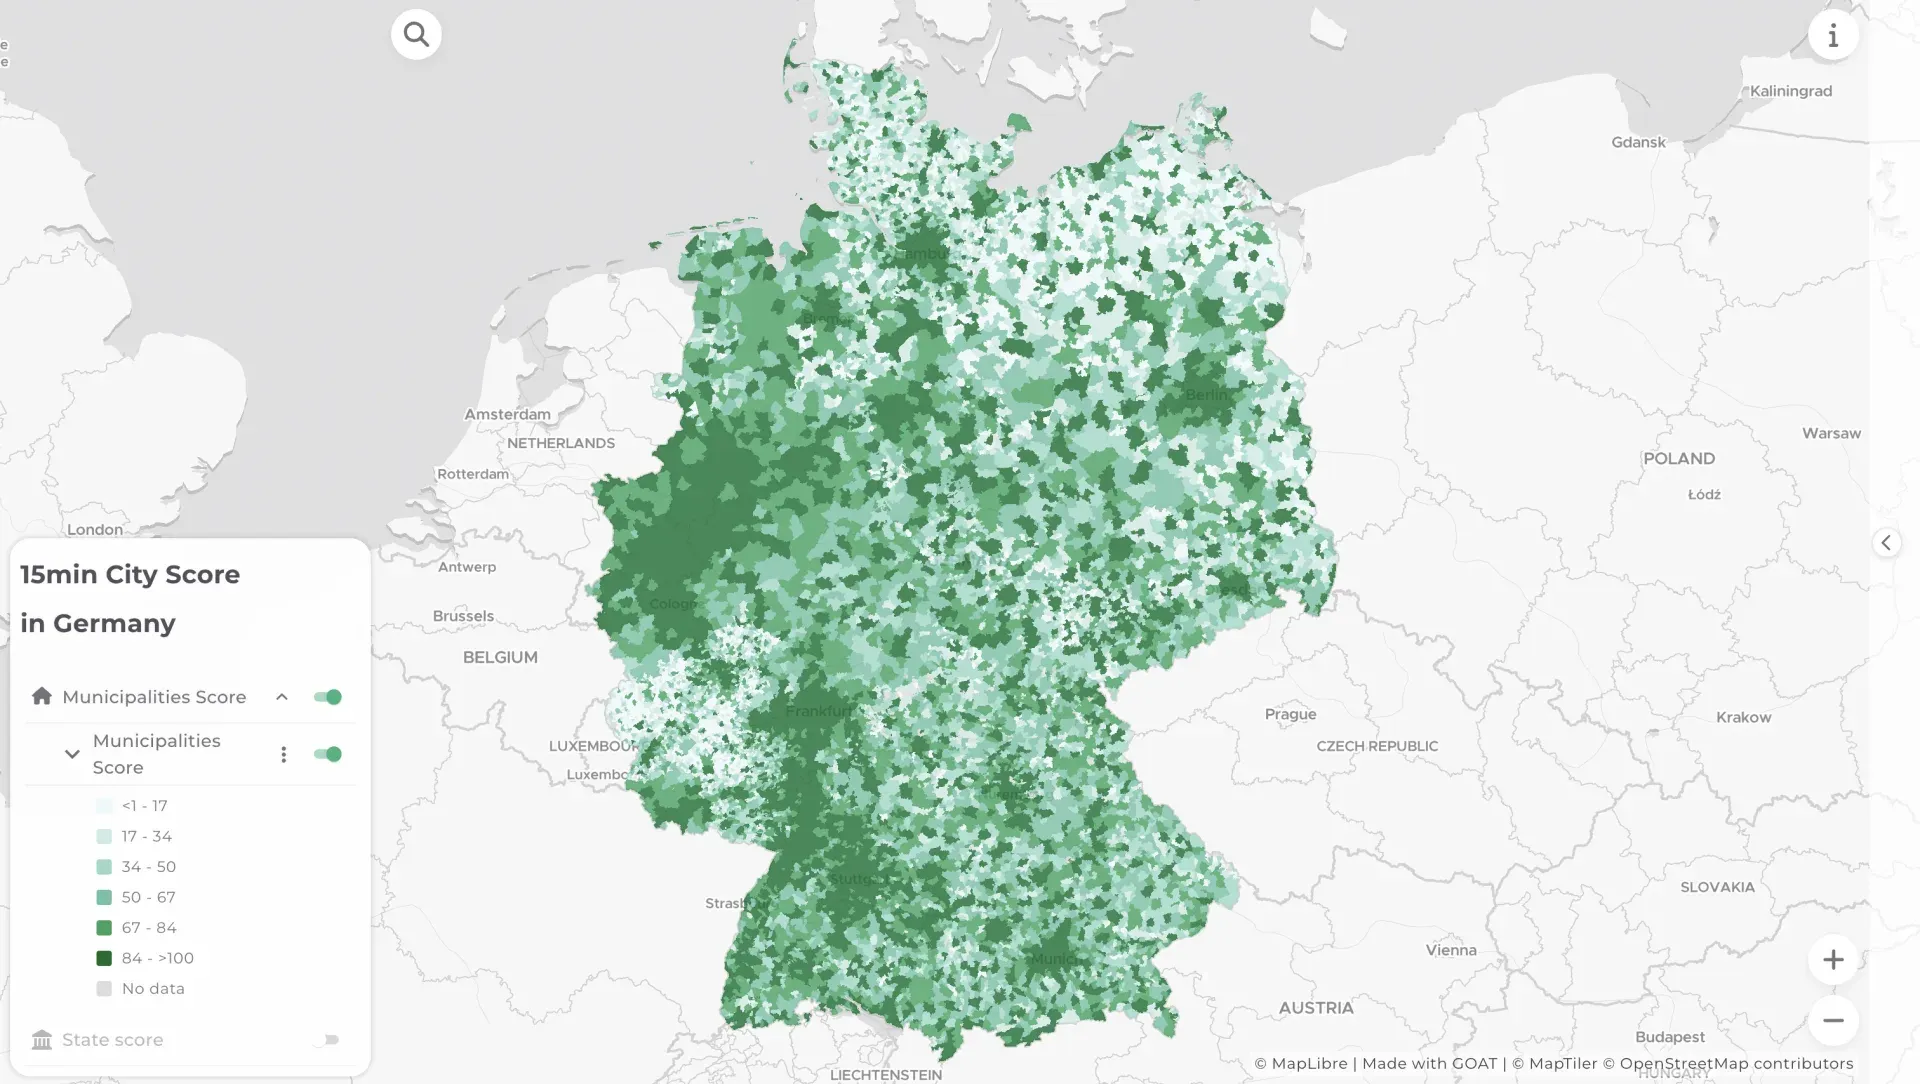
From Data to Message: How to Design a Map-Based Dashboard for Spatial Planning
Before building a map-based dashboard, four questions shape everything: What is the message, who is the target audience, what purpose does it serve, and how should the user navigate through it? A practical guide for spatial planners and analysts.
How GOAT is used across different industries
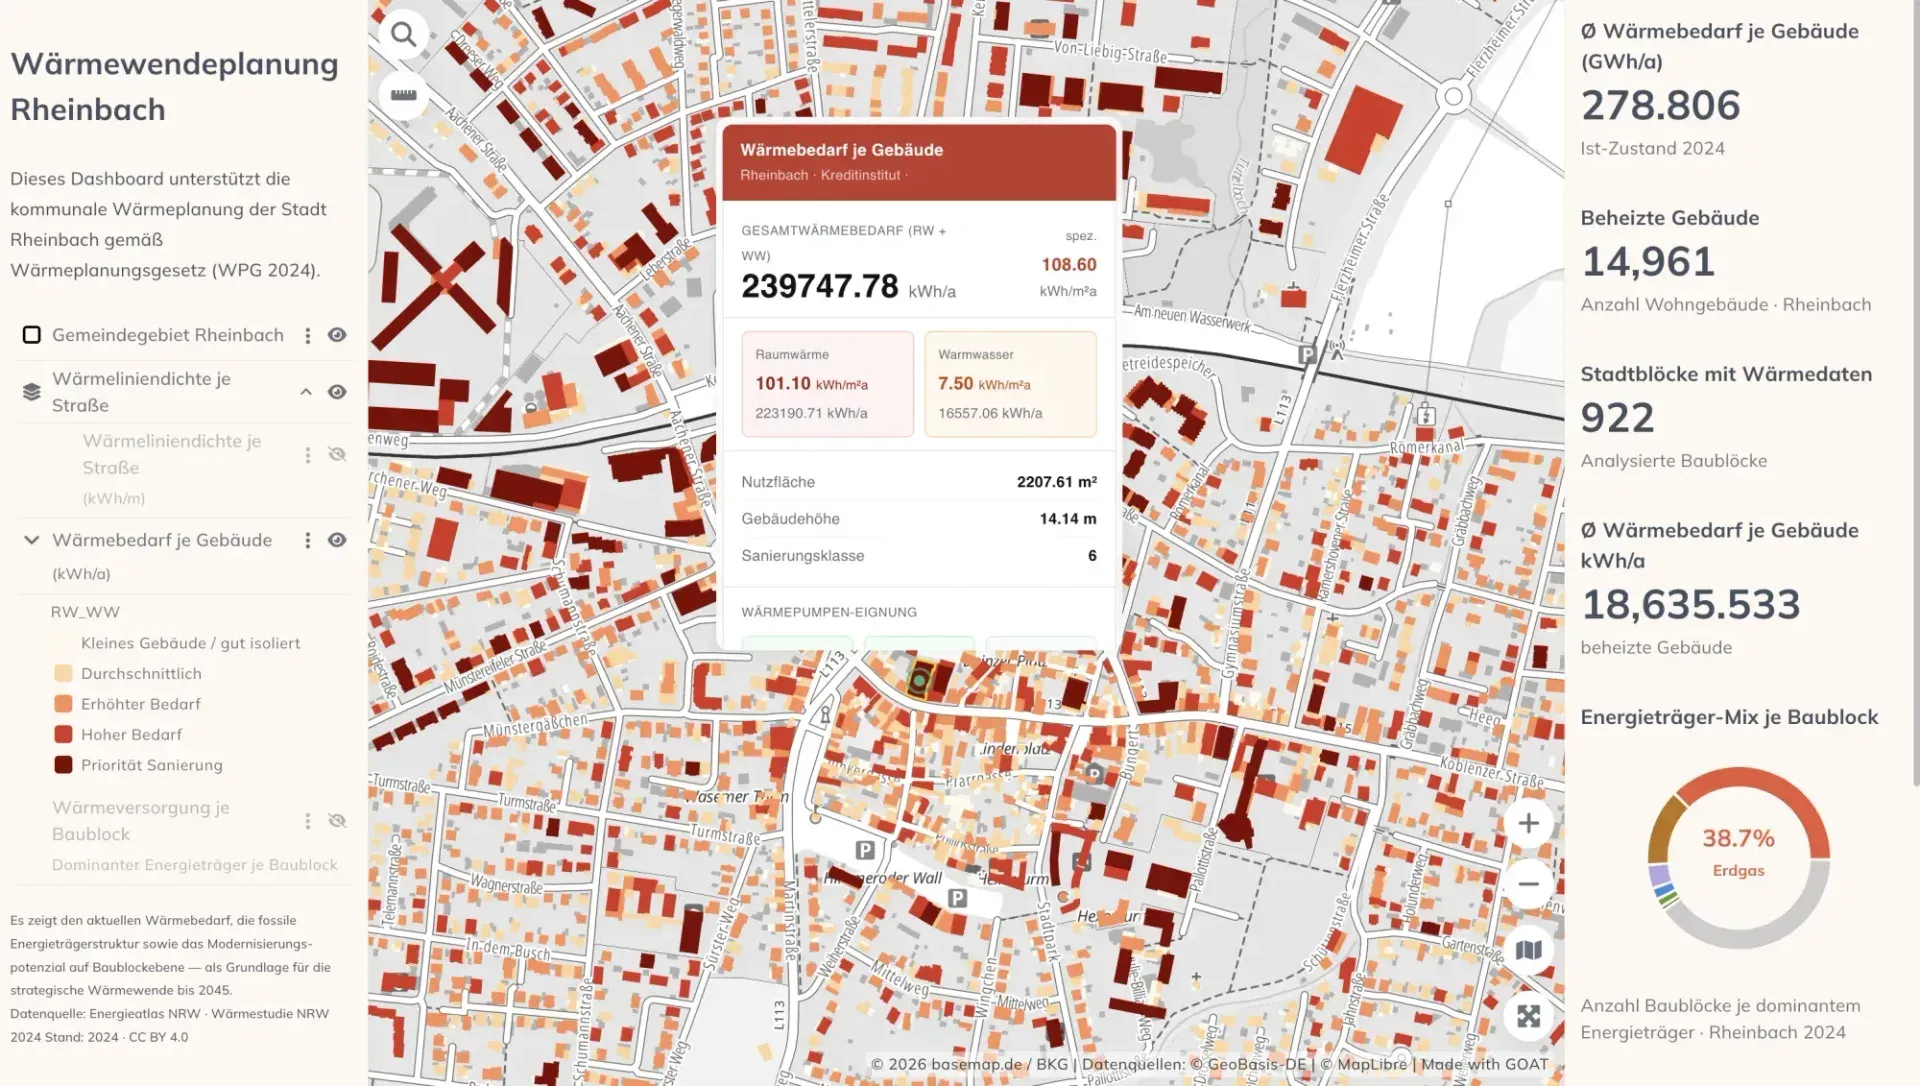
Practical examples from various industries
On our new industry pages, we showcase practical examples of how GOAT is used across different industries:
- Cities & Government
- Mobility Planning
- Real Estate
- Sustainability & Climate Risk
- Retail
- Healthcare
- Energy
More recommended reading from us
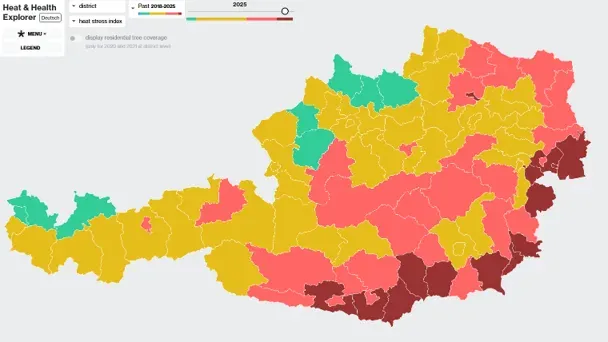
We’ve put together 8 examples of Map-Based Dashboards that are worth checking out as finished products for inspiration.
Check out our blog post on how to find, design and host free basemaps for MapLibre, QGIS and a tool like GOAT.
We hope you enjoy the rest of the summer — and maybe these topics and projects spark some inspiration for your own work!
Yours, Elias Pajares from Plan4Better