
Newsletter4Better September 2026
GOAT 3.0 is live, the ÖV-Atlas 2026 for Agora Verkehrswende is out, and what else happened over the summer: INTERGEO, the Deutsches Technikmuseum in Berlin and a map of the Oktoberfest.
Dear readers,
the summer went by, and we hope you had a proper break. We did not quite: usually when it is calm on your side, it is loud on ours. So the quiet brought some things with it. GOAT 3.0 is live. September also brought the ÖV-Atlas 2026, the analysis we ran for Agora Verkehrswende covering every inhabited square of Germany. And we made a map of the Oktoberfest, among others.
We hope you enjoy reading.
First, the important thing: GOAT V3 is here…
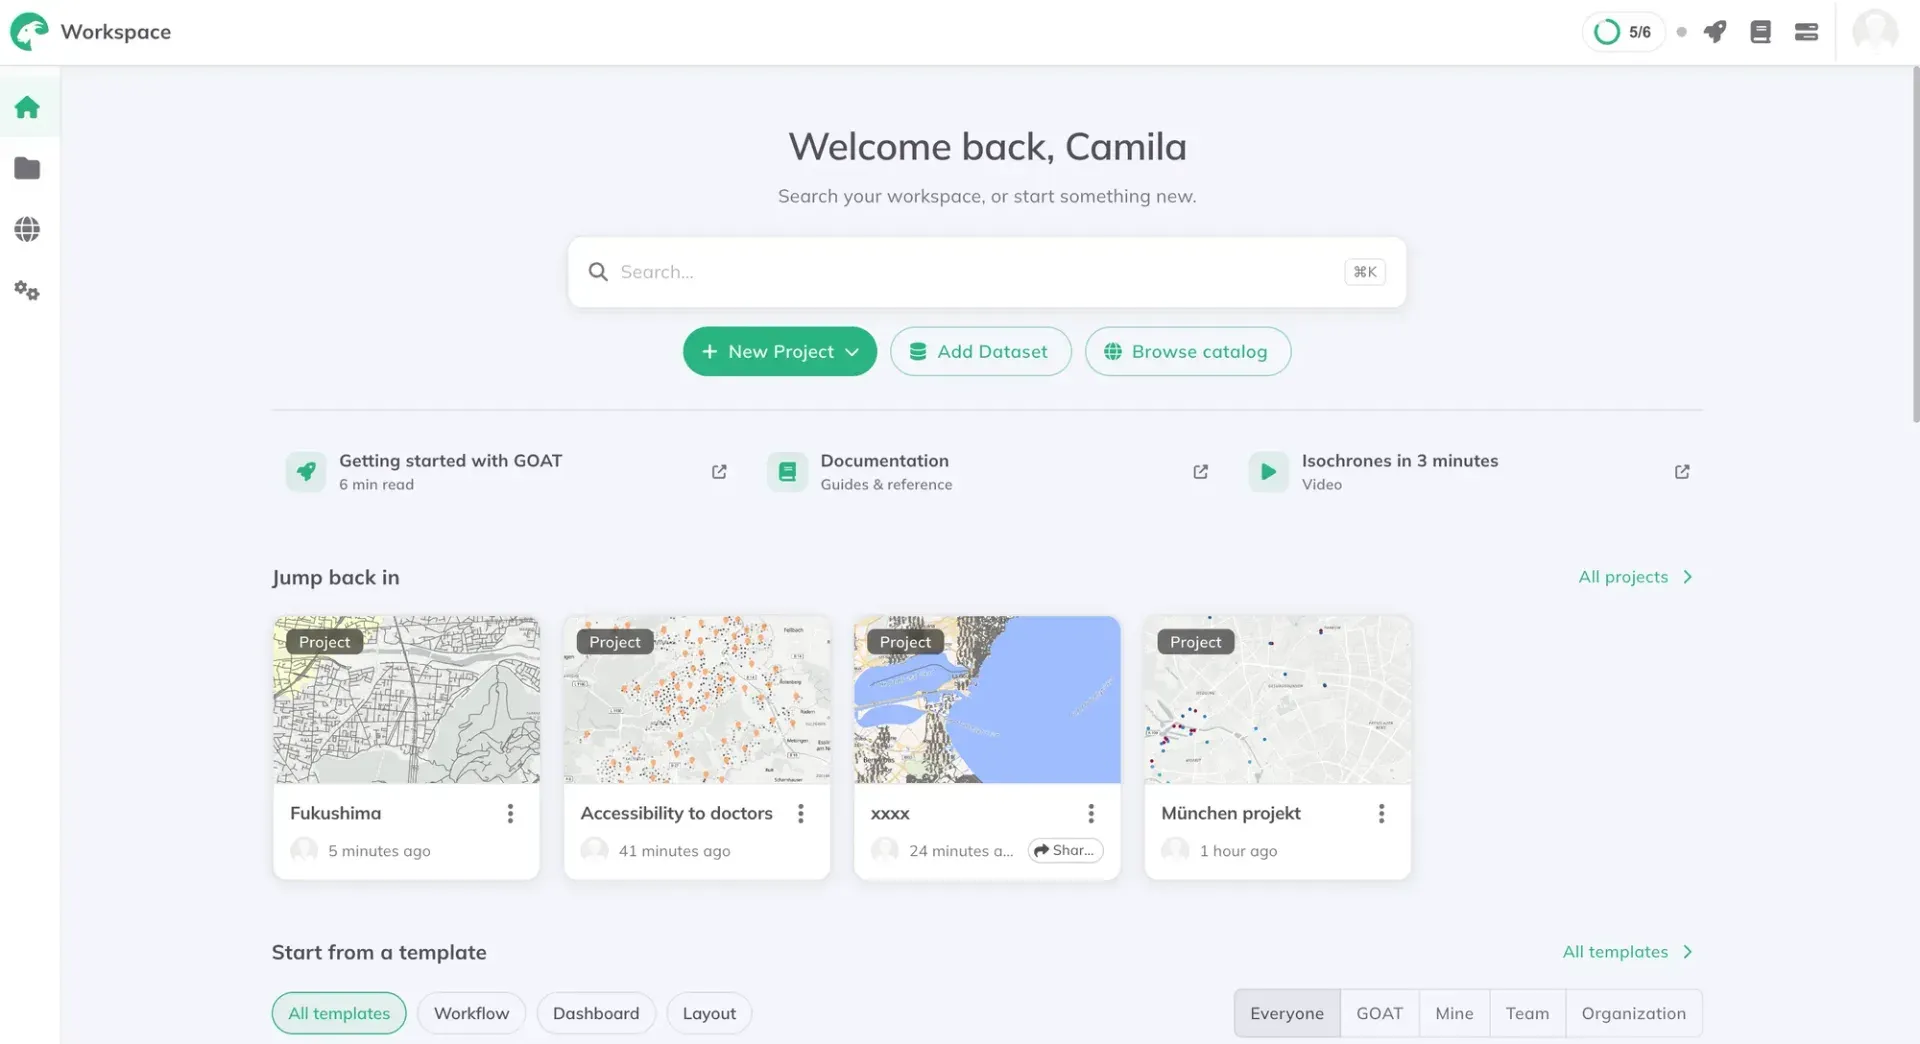
…and it is the biggest release we have shipped this year. The built-in data catalog grew from around 60 datasets to more than 30,000. Projects can now start from a template instead of an empty map. Everything you own sits in one workspace. And the accessibility indicators will run on your own street or transit network. You can check all the details in this article.
Public Transport Quality 2026
In 1881 Francis Galton coloured a map of the world by how long it took to get anywhere from London. Ten days to most of Europe. Forty or more to the middle of Africa. The shapes on it have nothing to do with distance and everything to do with steamship routes, and it is probably the first map anyone made of access rather than geography.

In 2026, we did it but for Germany, and public transport. The ÖV-Atlas 2026, which we computed for Agora Verkehrswende. Every inhabited 100 metre cell in Germany, graded ÖV-Güteklasse A to F. Around 11,000 municipalities, 400 districts. 30 million people live somewhere well served. 21 million do not.
The urban and rural split is the story everyone expects. It is not the one that surprised us. What decides which side of it you live on is which Bundesland you happen to be in. The report is free to read, and the full results download as Excel and GeoPackage under CC-BY.
A bit on events…
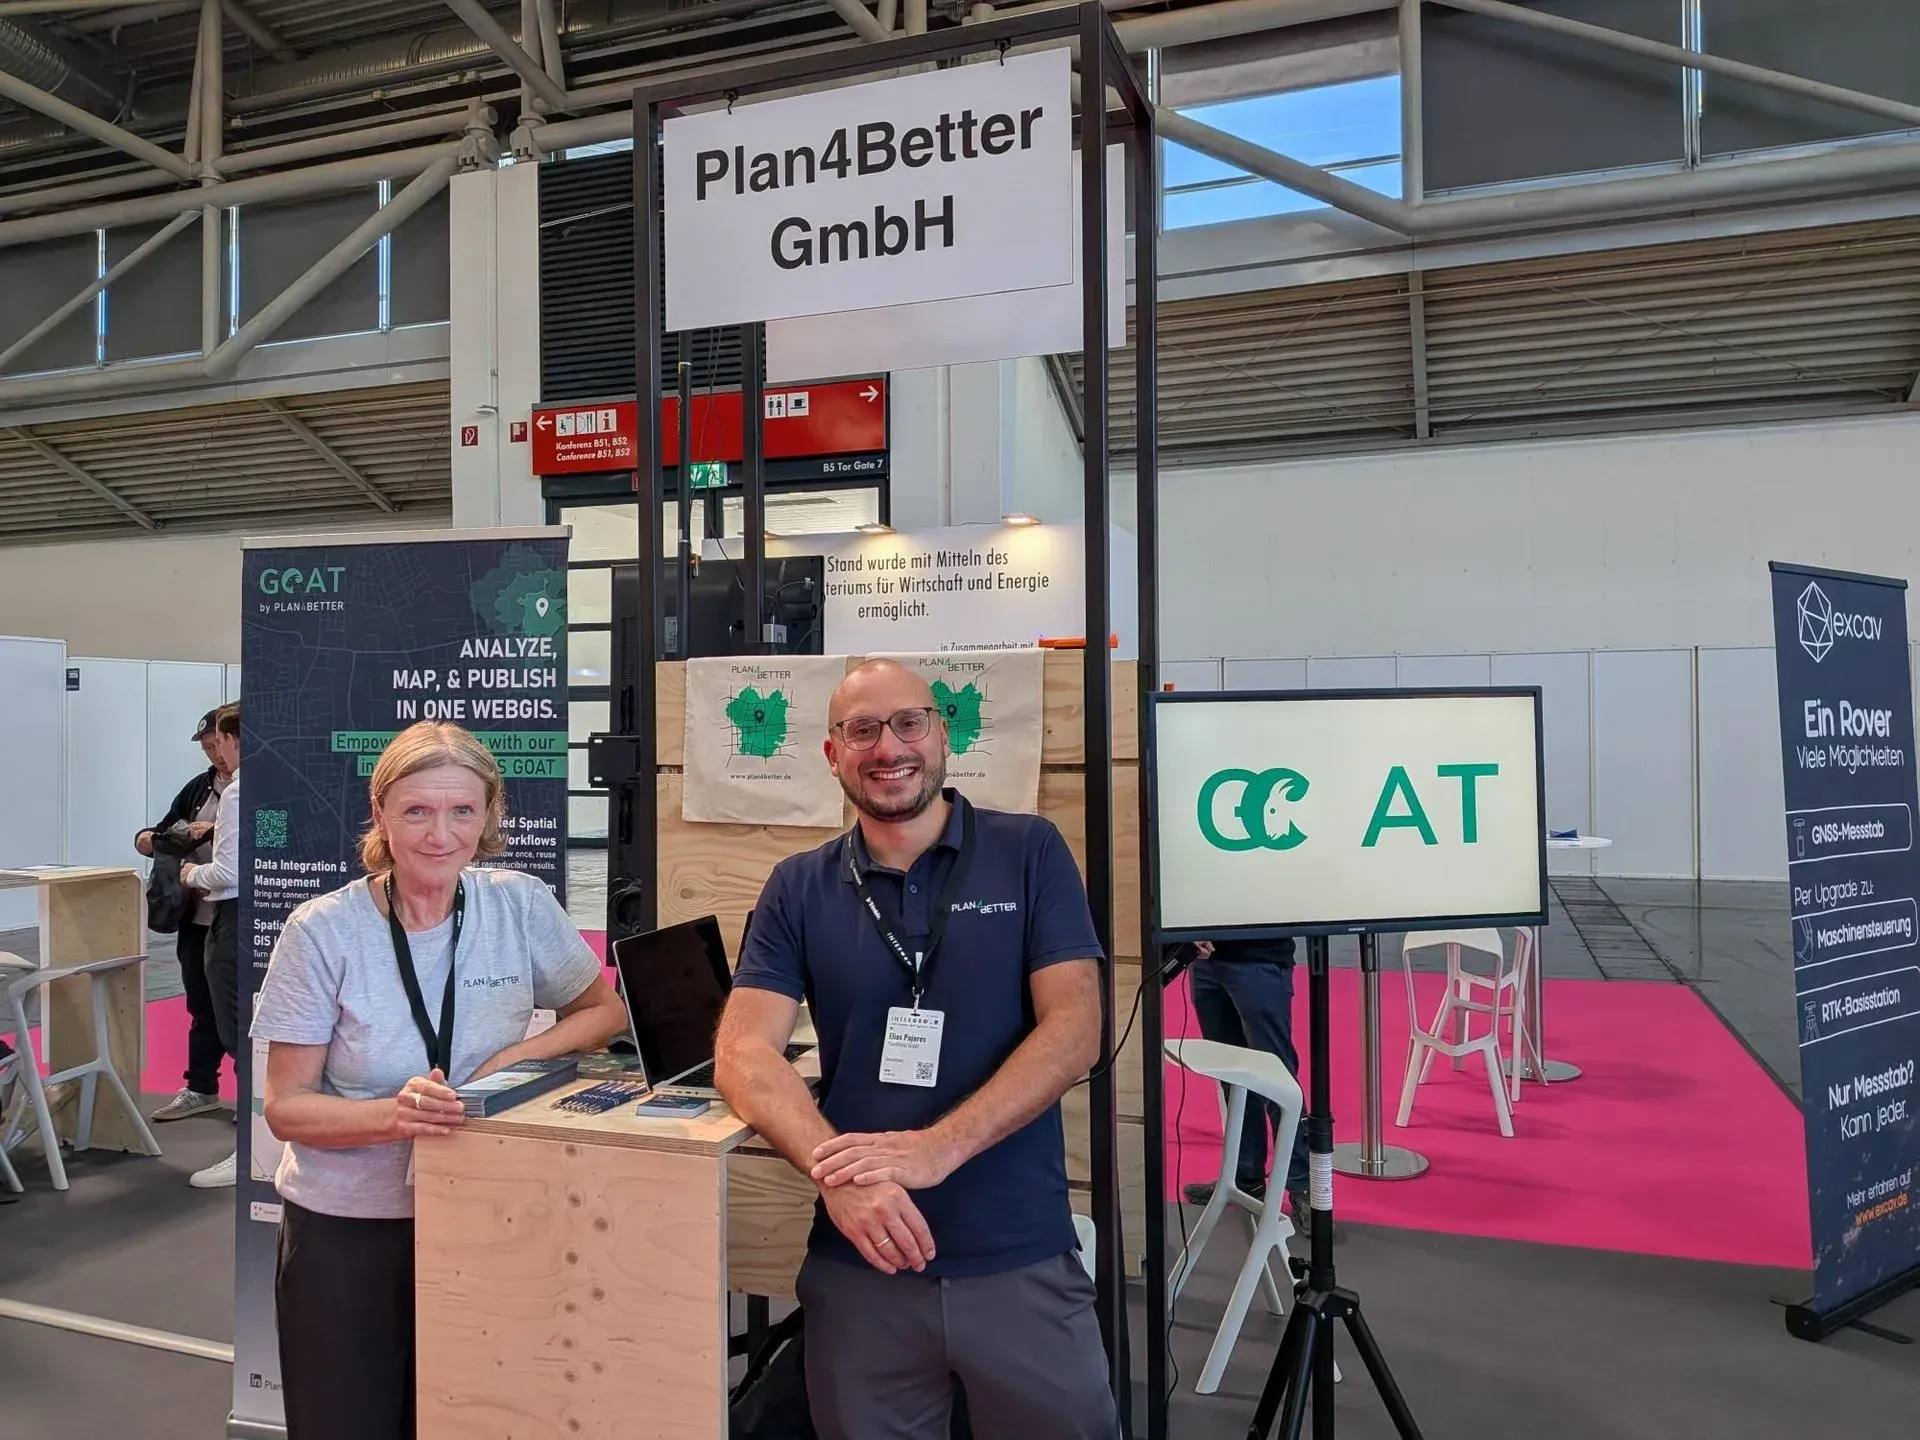
1. Elias and Susanne were at INTERGEO
The proof is the photo. Three days of very good conversations with customers and partners, and plenty of new faces and projects too. INTERGEO is a very international tradeshow with a highly qualified audience. Many thanks to everyone who stopped by our booth!
2. This is for Berliners
GOAT is part of the “Digital Sovereignty Experience Space” at the Deutsches Technikmuseum in Berlin, an immersive exhibition on mobility, logistics and how cities move. You can try out how data-driven applications built in Germany help you find accessible places and see how easily a destination can be reached. We built three dashboards for it, so of course we recommend going. It runs until the end of December.
Three more things
A climate indicator either changes a decision or sits on a screen, and the difference is rarely technical. We went looking at Karlsruhe’s sensors, Frankfurt’s Klimaplanatlas, Vienna’s heat map and the Dutch stress tests to work out what separates the two. The post is here.
Gokul spent an afternoon with open data and produced this map of Bedburg: rooftop solar potential against heat demand, block by block. The blocks where both run high are where you would start.
And our website was redesigned :)
That is it for this month. We hope something in here is useful for what you are working on.
Yours, Elias Pajares from Plan4Better