Newsletter4Better Christmas 2025
A look back at 2025: the GOAT releases “Ibex” and “Cashmere”, new projects in Hamburg and Basel, our #30DayMapChallenge and how we work with QGIS.
As the year draws to a close, we’re filled with gratitude for an incredible 12 months of progress, innovation, and community. 2025 was a landmark year for us, driven by further developing our WebGIS platform GOAT. Your support, feedback, and enthusiasm fueled every step of this journey.
Together with partners and customers we also successfully completed many new projects. You can read more about them in this edition of our newsletter.
But it’s not just about milestones and projects. It’s about the people behind them – you.
As we head into the holiday season, we want to take a moment to thank you for being part of our story. From all of us here, we wish you a joyful Christmas and a New Year filled with success, happiness, and new possibilities!
Yours sincerely, Elias Pajares, Plan4Better CEO
News
GOAT releases “Ibex” and “Cashmere” – More control, less friction
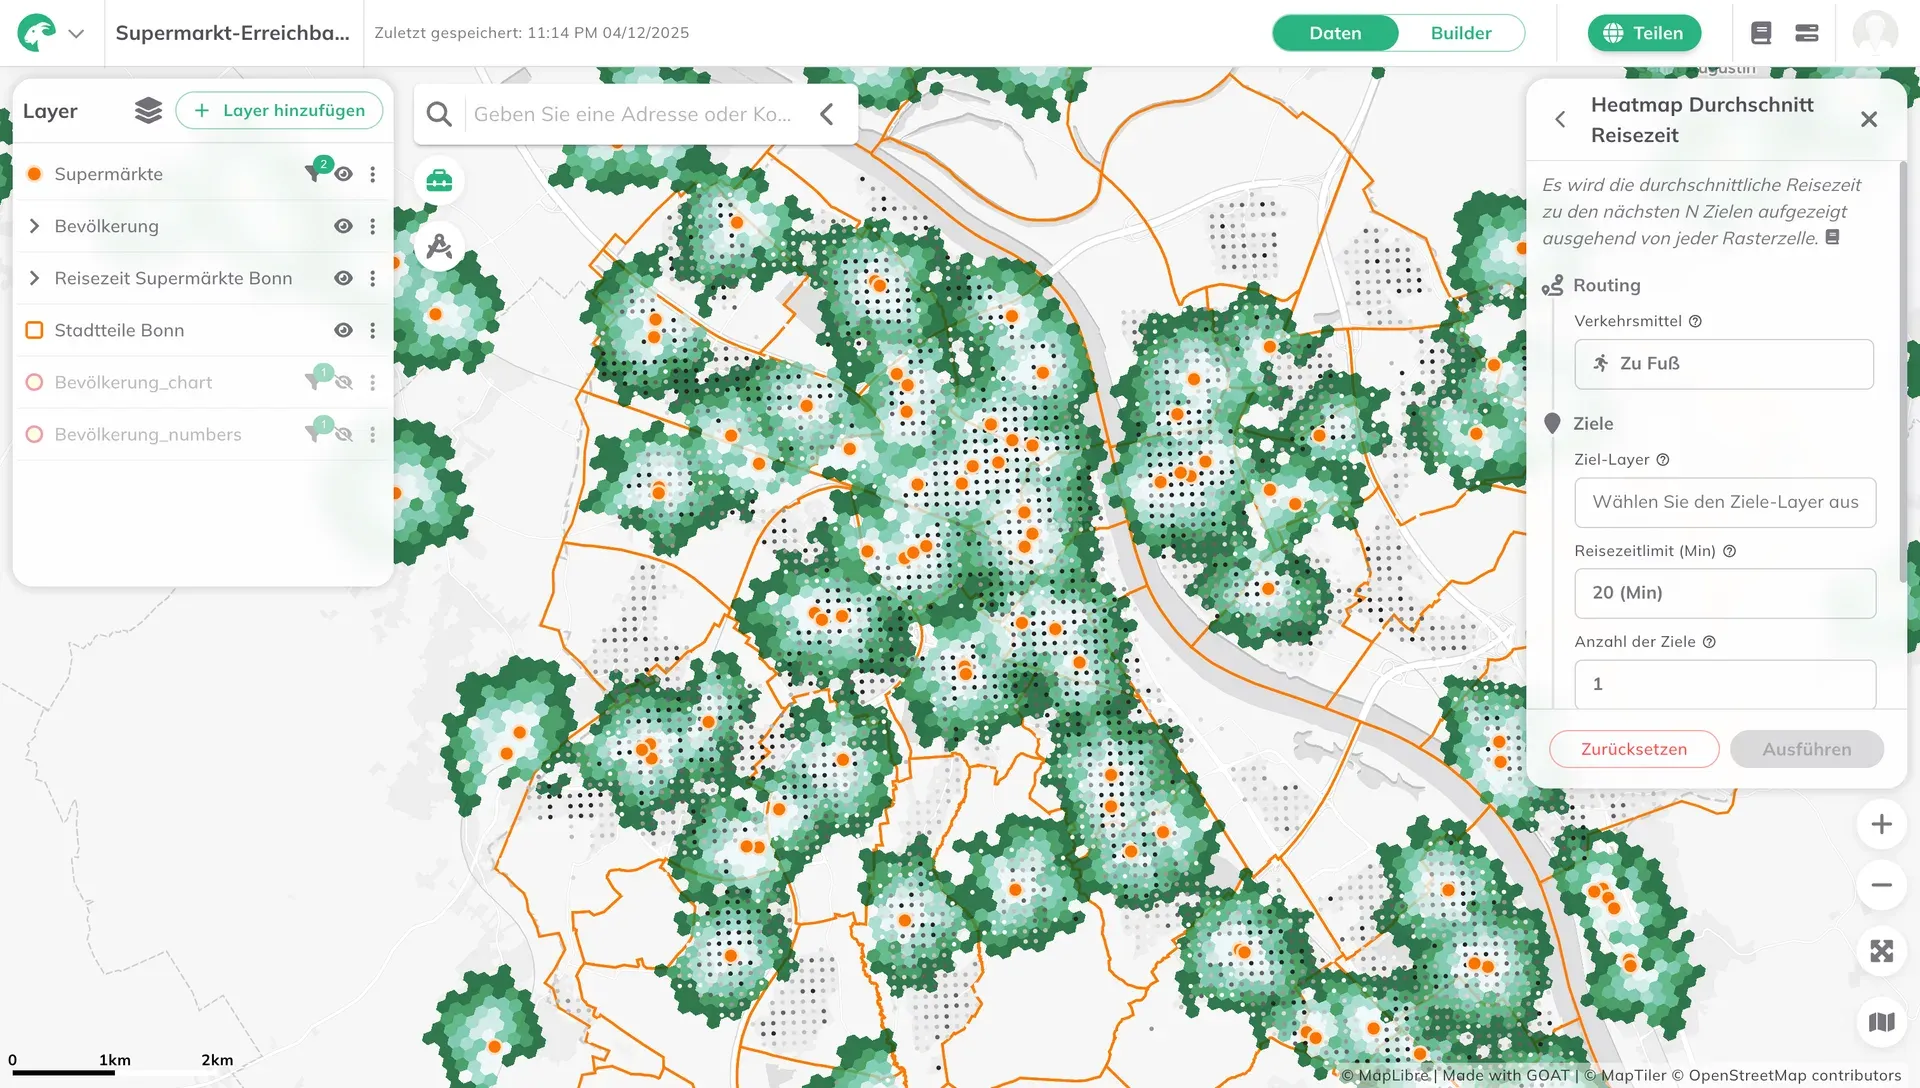
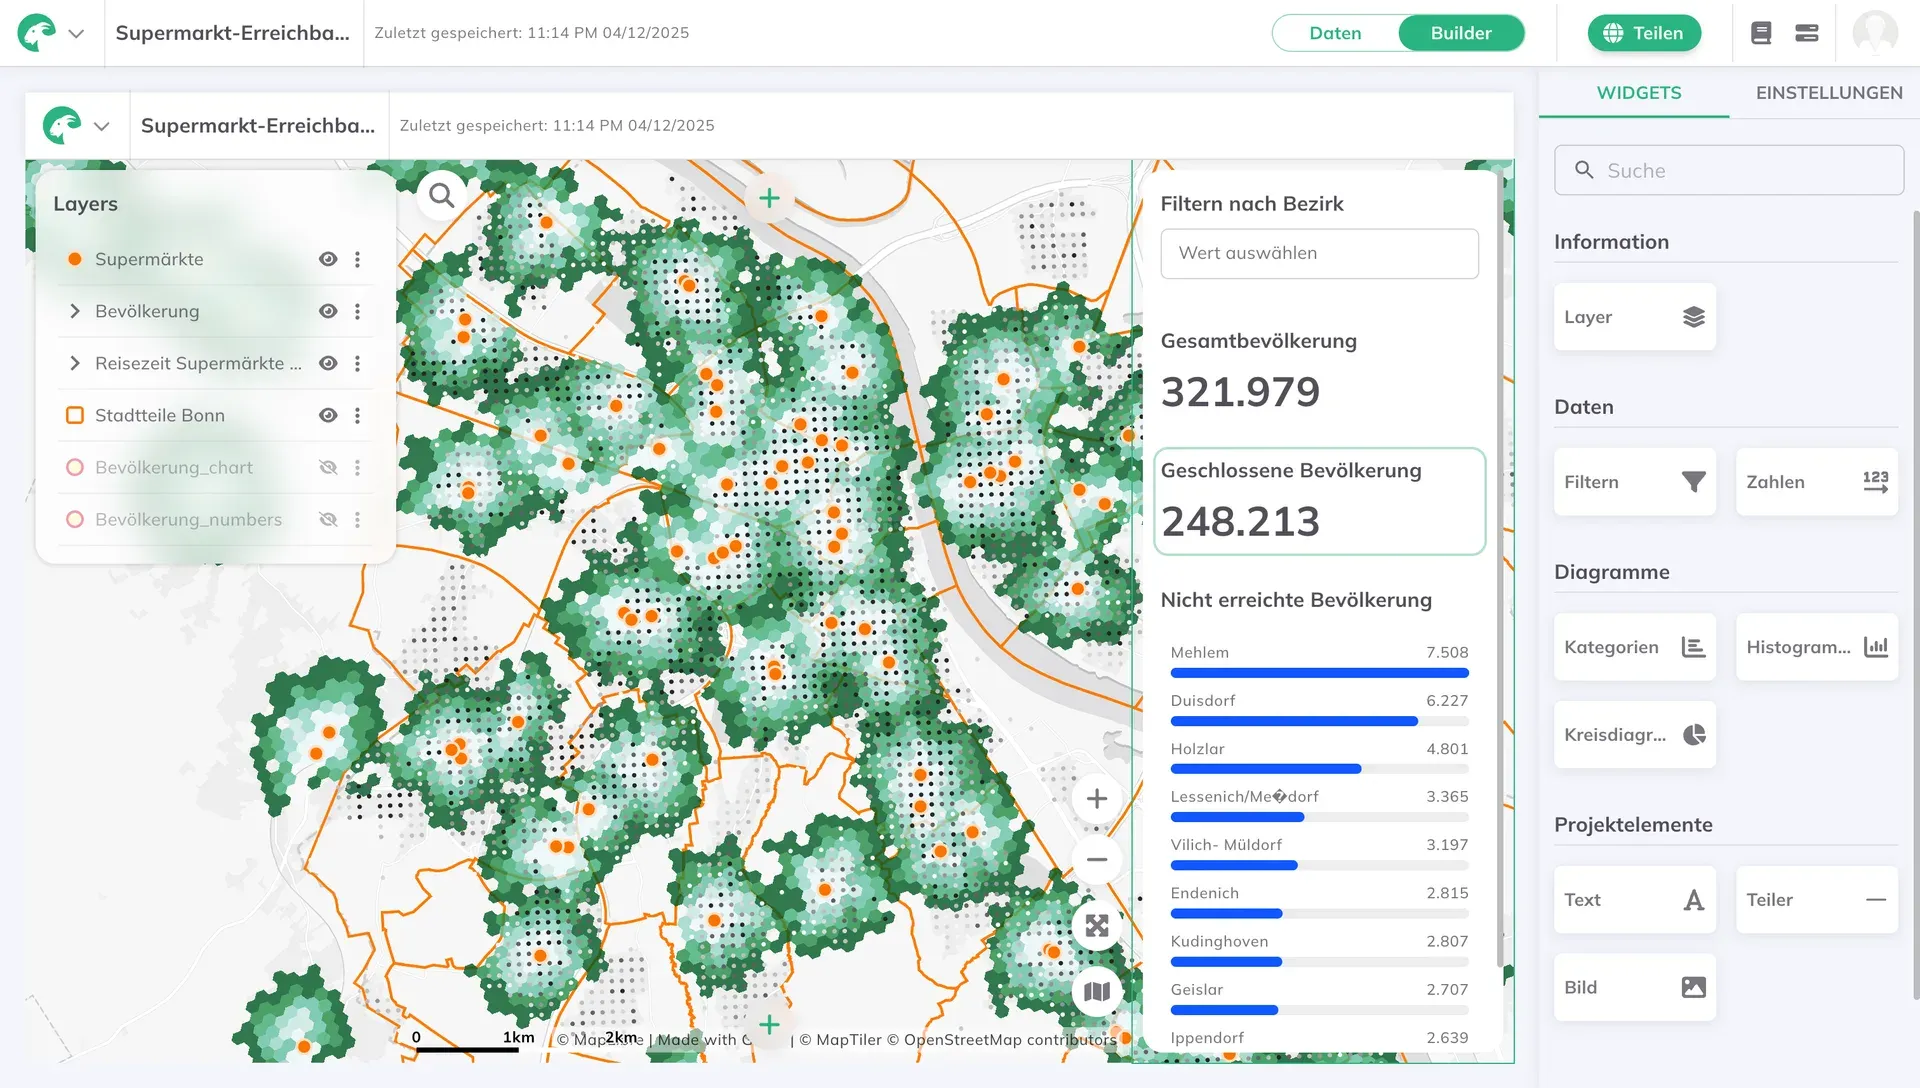
Over the last year we’ve been constantly evolving our WebGIS GOAT. Our latest GOAT releases—versions 2.1.0 “Ibex” and 2.2.0 “Cashmere”—put powerful mapping tools directly in your hands. Highlights include:
- Redesigned Data Mode UI – Data Mode has been refreshed with a cleaner, more intuitive interface, making it easier to browse and understand
- Custom dashboards – Arrange widgets to match how you analyze and present data
- Layer Groups – Group layers into logical collections
- Your own icons – Upload custom symbols to make maps align with your project’s visual identity
- Simple Style for dashboard layers – Now on public maps, users can make quick, lightweight visual adjustments to layers (e.g. opacity).
- Faster data management – Rename or delete datasets directly from the interface
- Performance upgrades – Faster loading, smoother interactions, and expanded regional support
Whether you’re planning 15-minute cities, optimizing transit networks or boosting community resilience, GOAT helps you turn complex data into actionable insights—faster than ever.
Check out our latest blog posts on “Ibex” and “Cashmere”.
Ready to get started? Sign up for a free account and explore our updated docs today.
Reading recommendation
Why Europe needs its own geospatial software – and why Open Source is part of the answer
Europe’s planning systems rely heavily on foreign, proprietary geospatial tools — creating risks around transparency, control, and long-term digital sovereignty. Open-source European platforms like GOAT offer a different path. The choices planners make today will shape Europe’s digital foundations for decades to come. Read more about our take here.

New projects
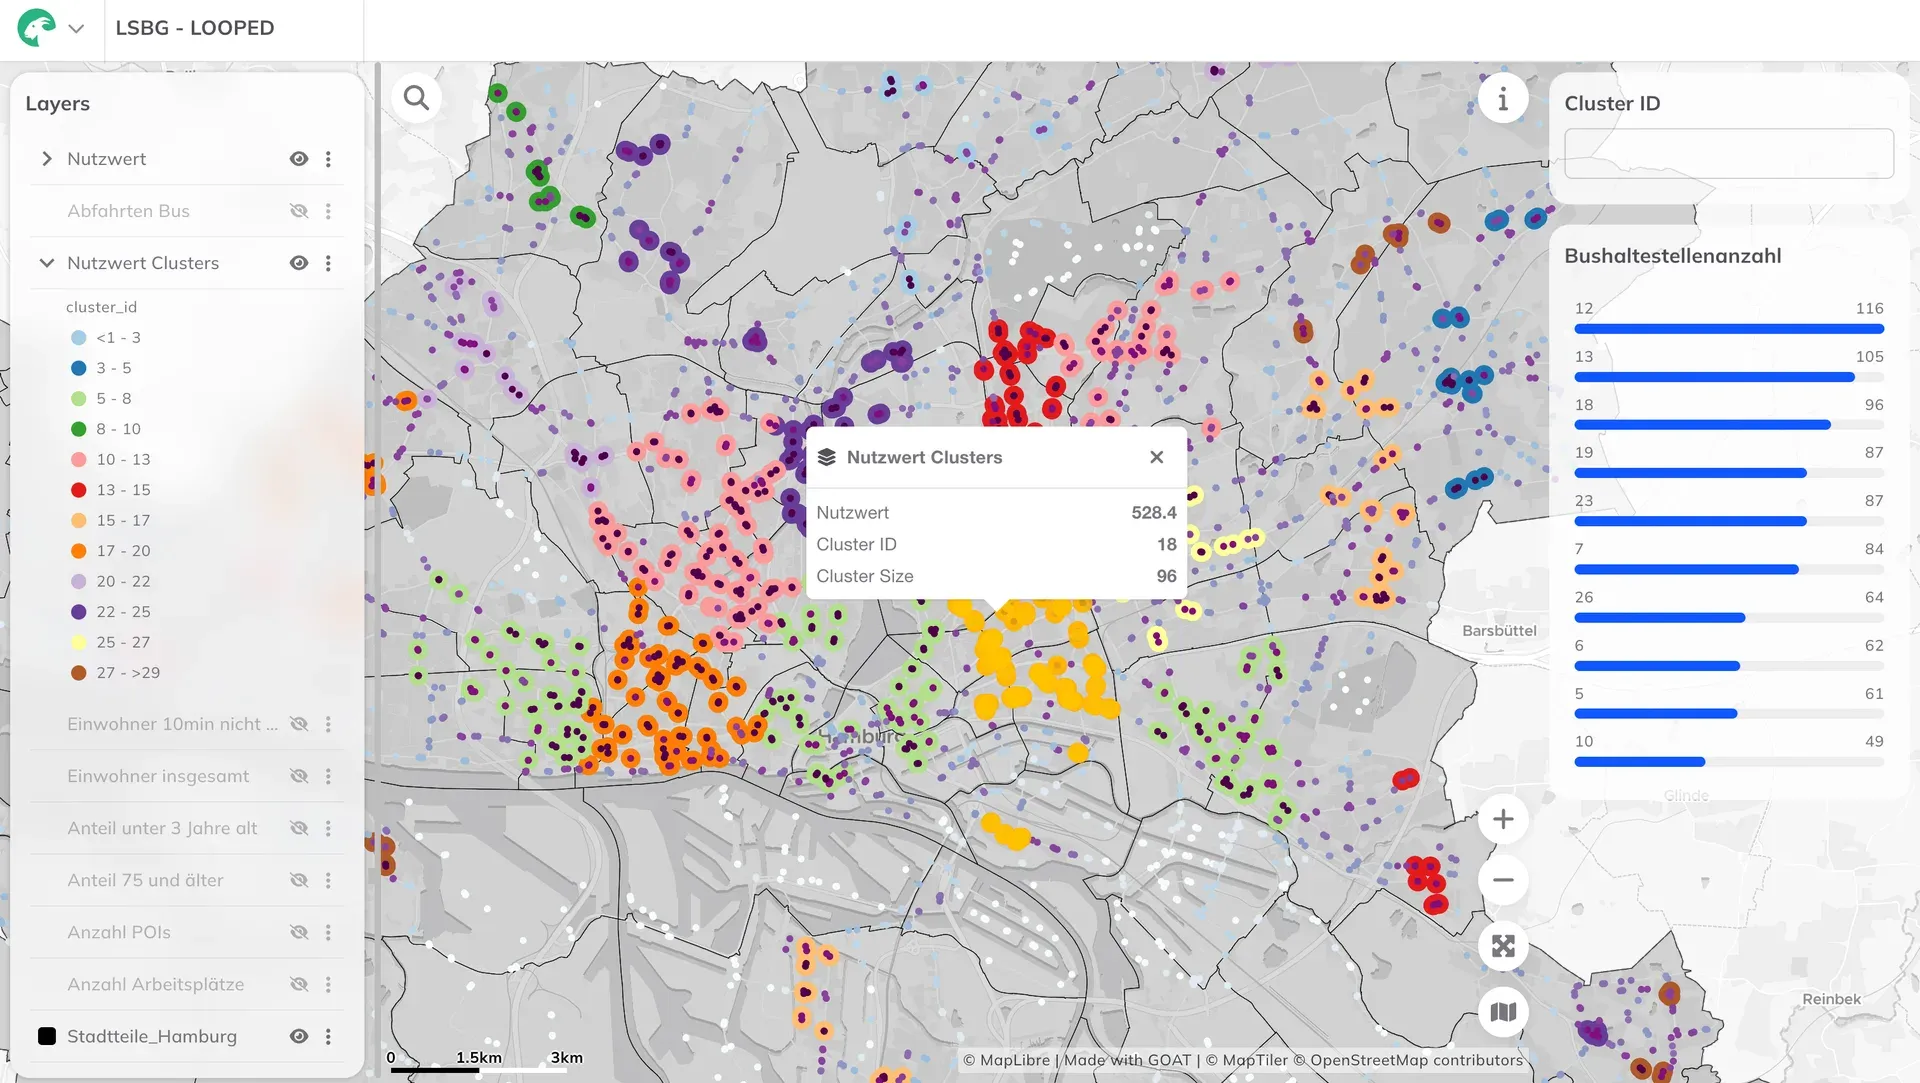
Location Analysis for Bus Stops in Hamburg with WebGIS GOAT
The Hamburg State Agency for Roads, Bridges and Waterways (LSBG) is tasked with systematically retrofitting approximately 2,400 bus stops for barrier-free access. The automated, standardized multi-criteria analysis required for this is being developed using the WebGIS GOAT.
Read more about it here.
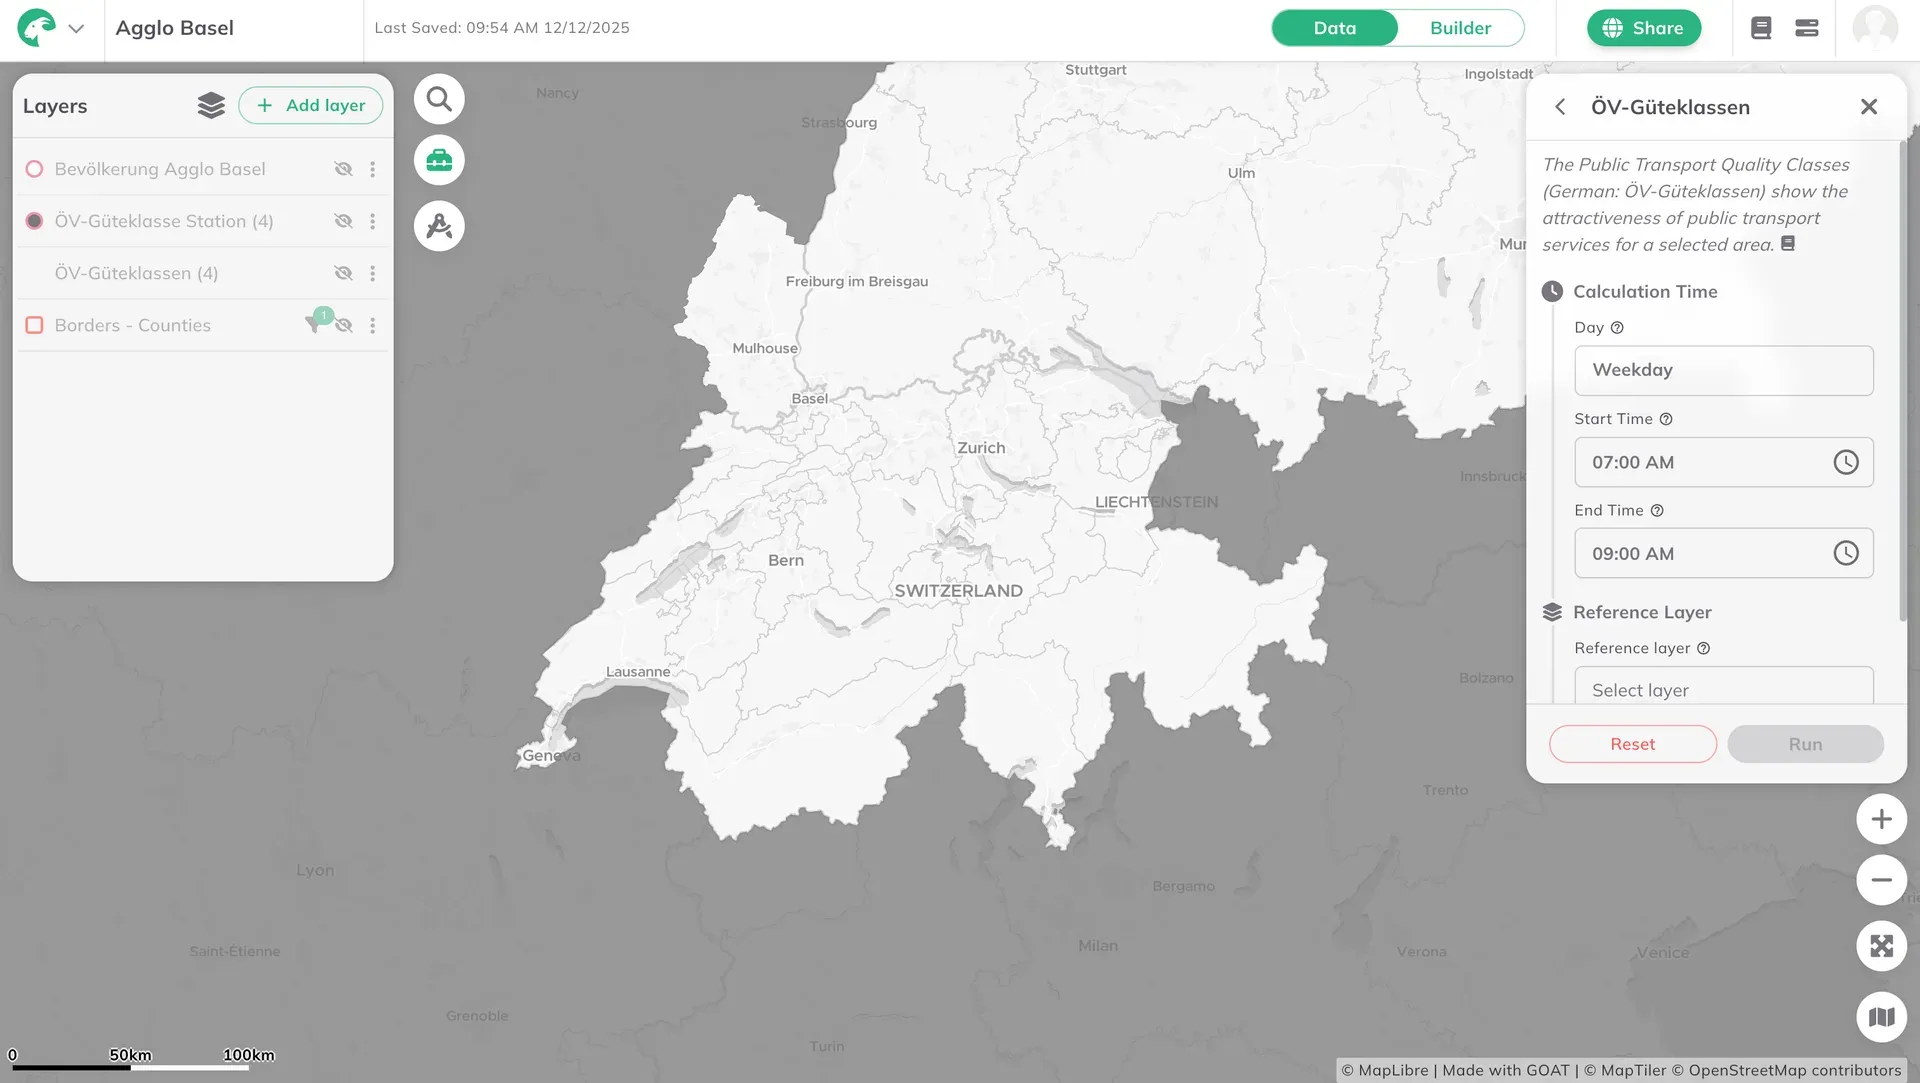
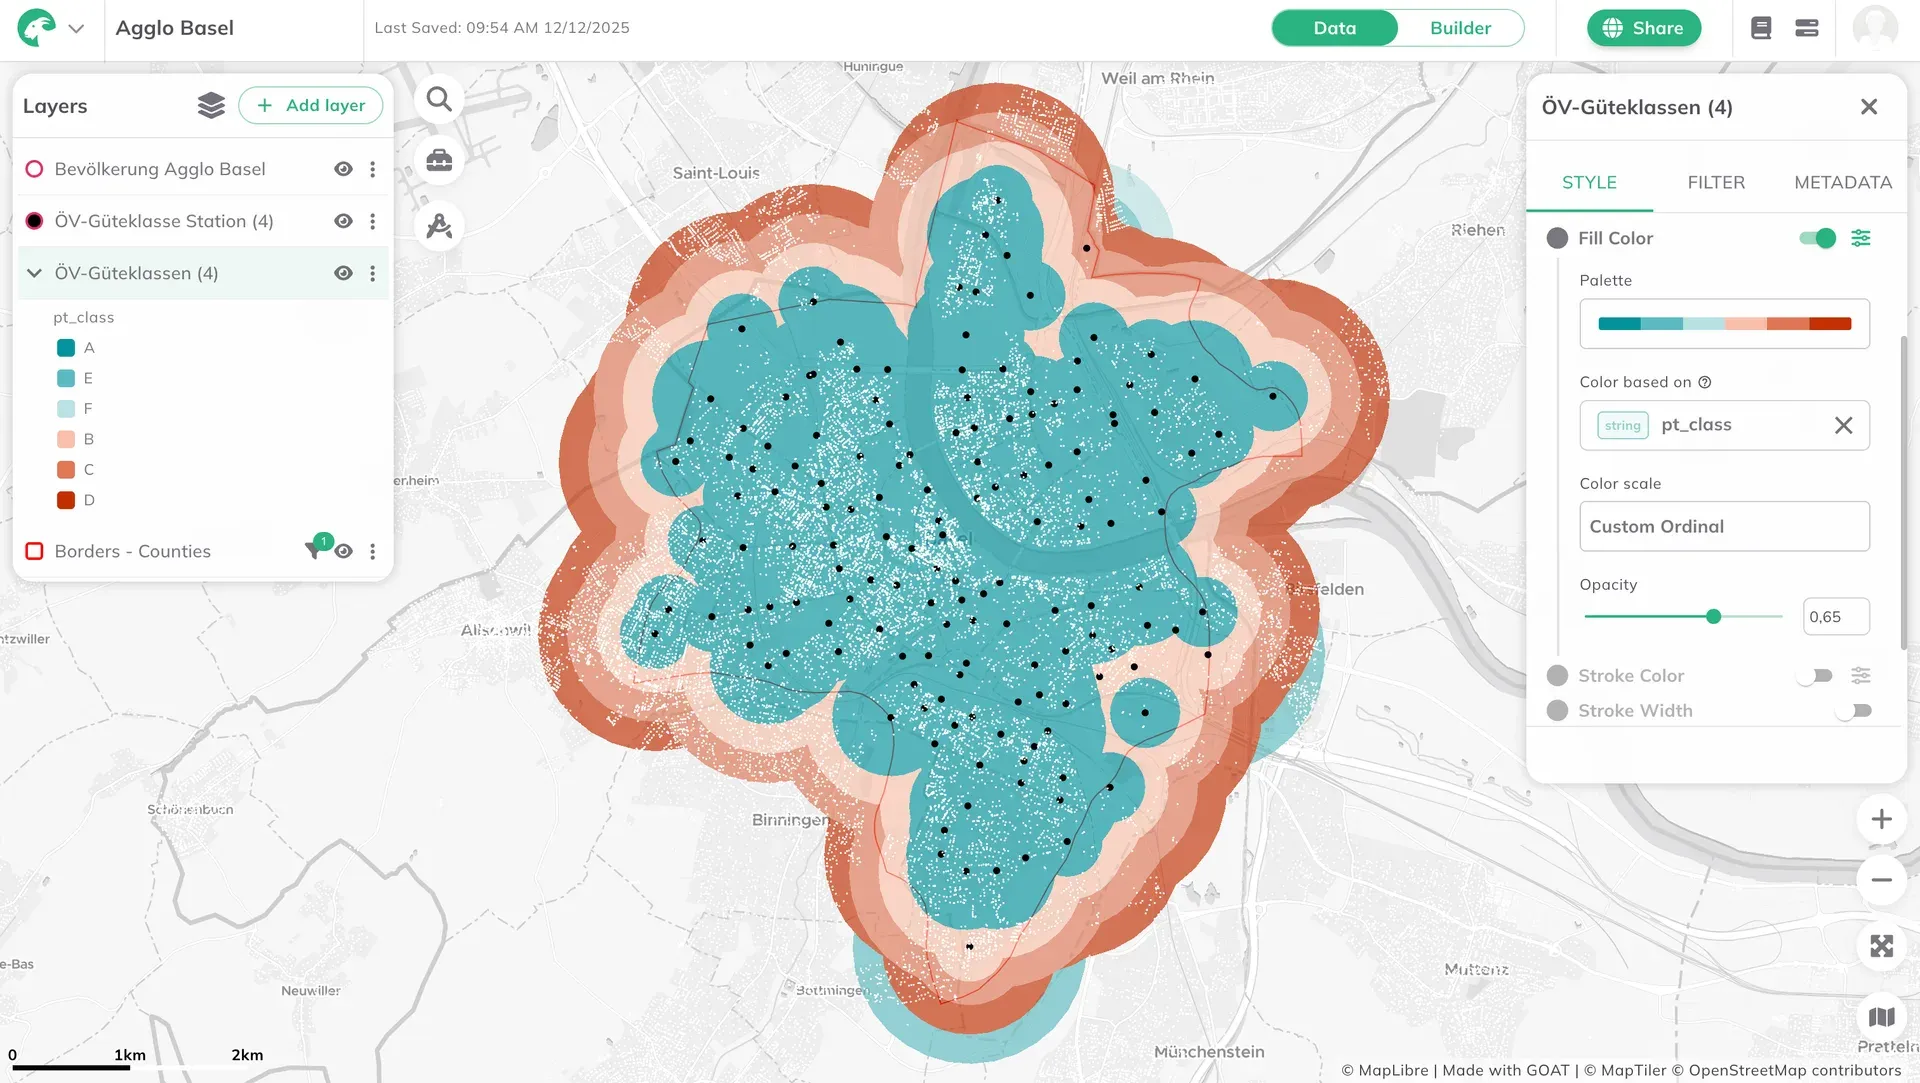
Cross-border analyses with the WebGIS GOAT at Agglo Basel
Agglo Basel now uses the WebGIS GOAT for cross-border accessibility analyses. To address local requirements, additional data have been integrated into GOAT.
Read more about it here.
Featured article
#30DayMapChallenge
This November, the Plan4Better team took on the #30DayMapChallenge—not as solo cartographers, but as a collective. It became an opportunity to experiment, collaborate, and push the boundaries of what we can do with and without GOAT, our open-source planning tool.
From streetlights in Vienna to Saharan dust plumes over Tunisia, from colorblind-friendly subway maps to analog string art, we turned data into stories.
Read in our new blog post how we did it, and what we learned along the way.
Practical example
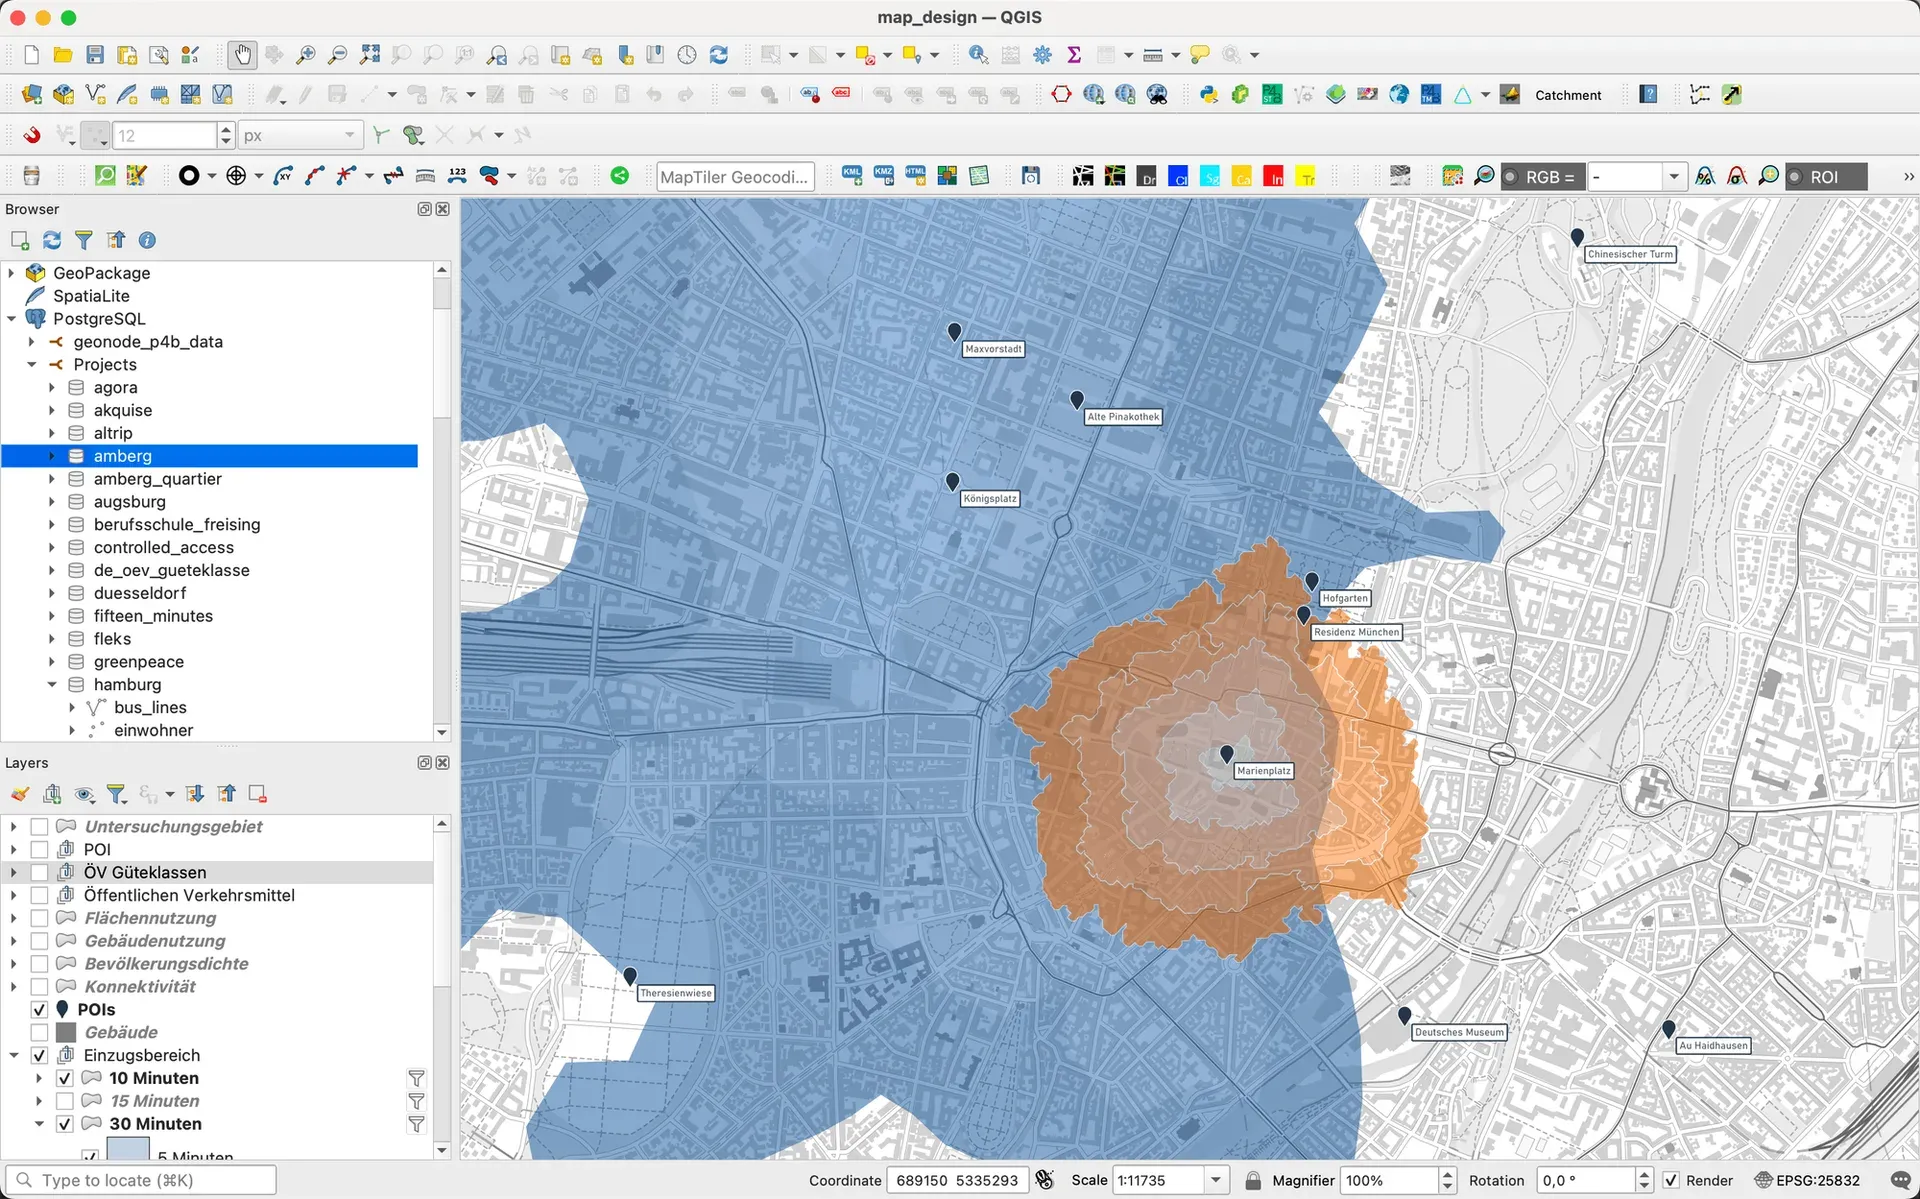
How we work with QGIS for Data Analysis and Visualization
Open source isn’t just a philosophy for us—it’s how we work. QGIS and GOAT together form our spatial analysis powerhouse.
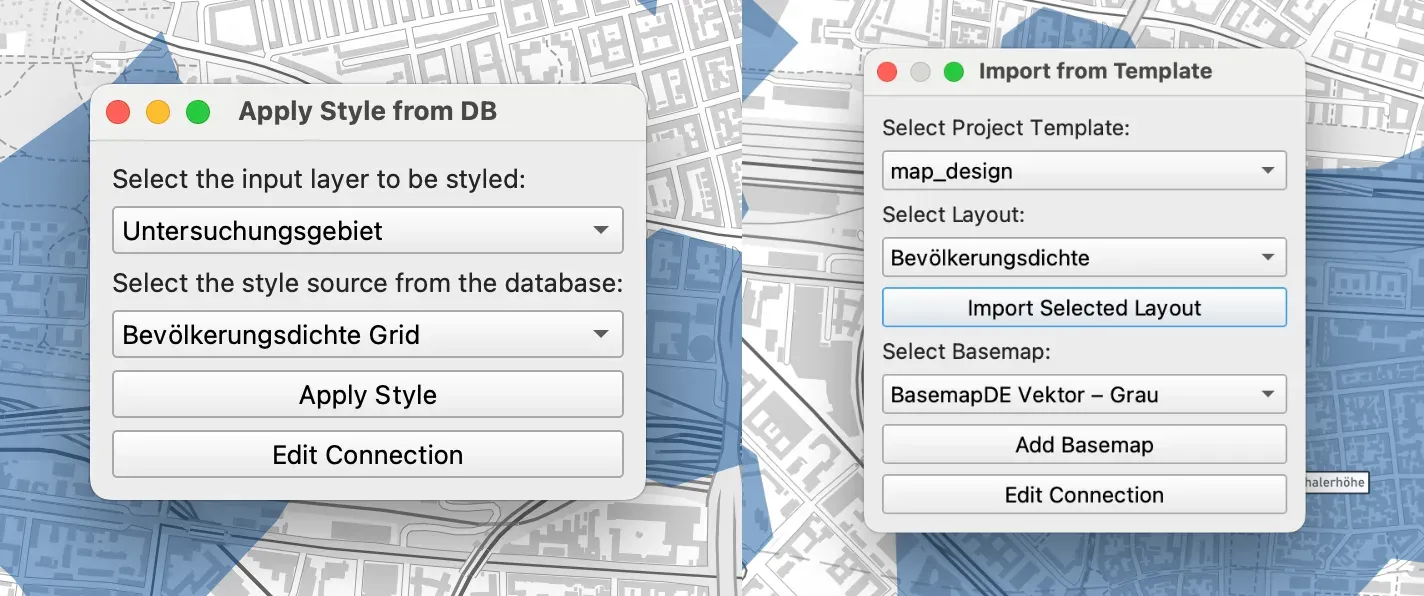
Our work revolves around geodata, spatial analysis, and digital planning tools, helping cities and governments design livable spaces. At the heart of our workflow is QGIS, the open-source GIS platform which we integrate with our open-source tool GOAT, and together they enable us to process, analyze, and visualize complex spatial data efficiently.
In our new blog post, our GIS Analyst Gokul Gopan along with our cartographer Camila Narbaitz, tell the story of how we implement QGIS within P4B. You can read the blog post here.