
Solutions
Retail planning for municipalities
A circle around a store does not show who can actually reach it. We measure catchment areas along the real street network, show where people live with no shop for everyday needs within reach and how many they are, estimate how demand splits between competing stores, and test what a new site would change. The analysis runs in GOAT.
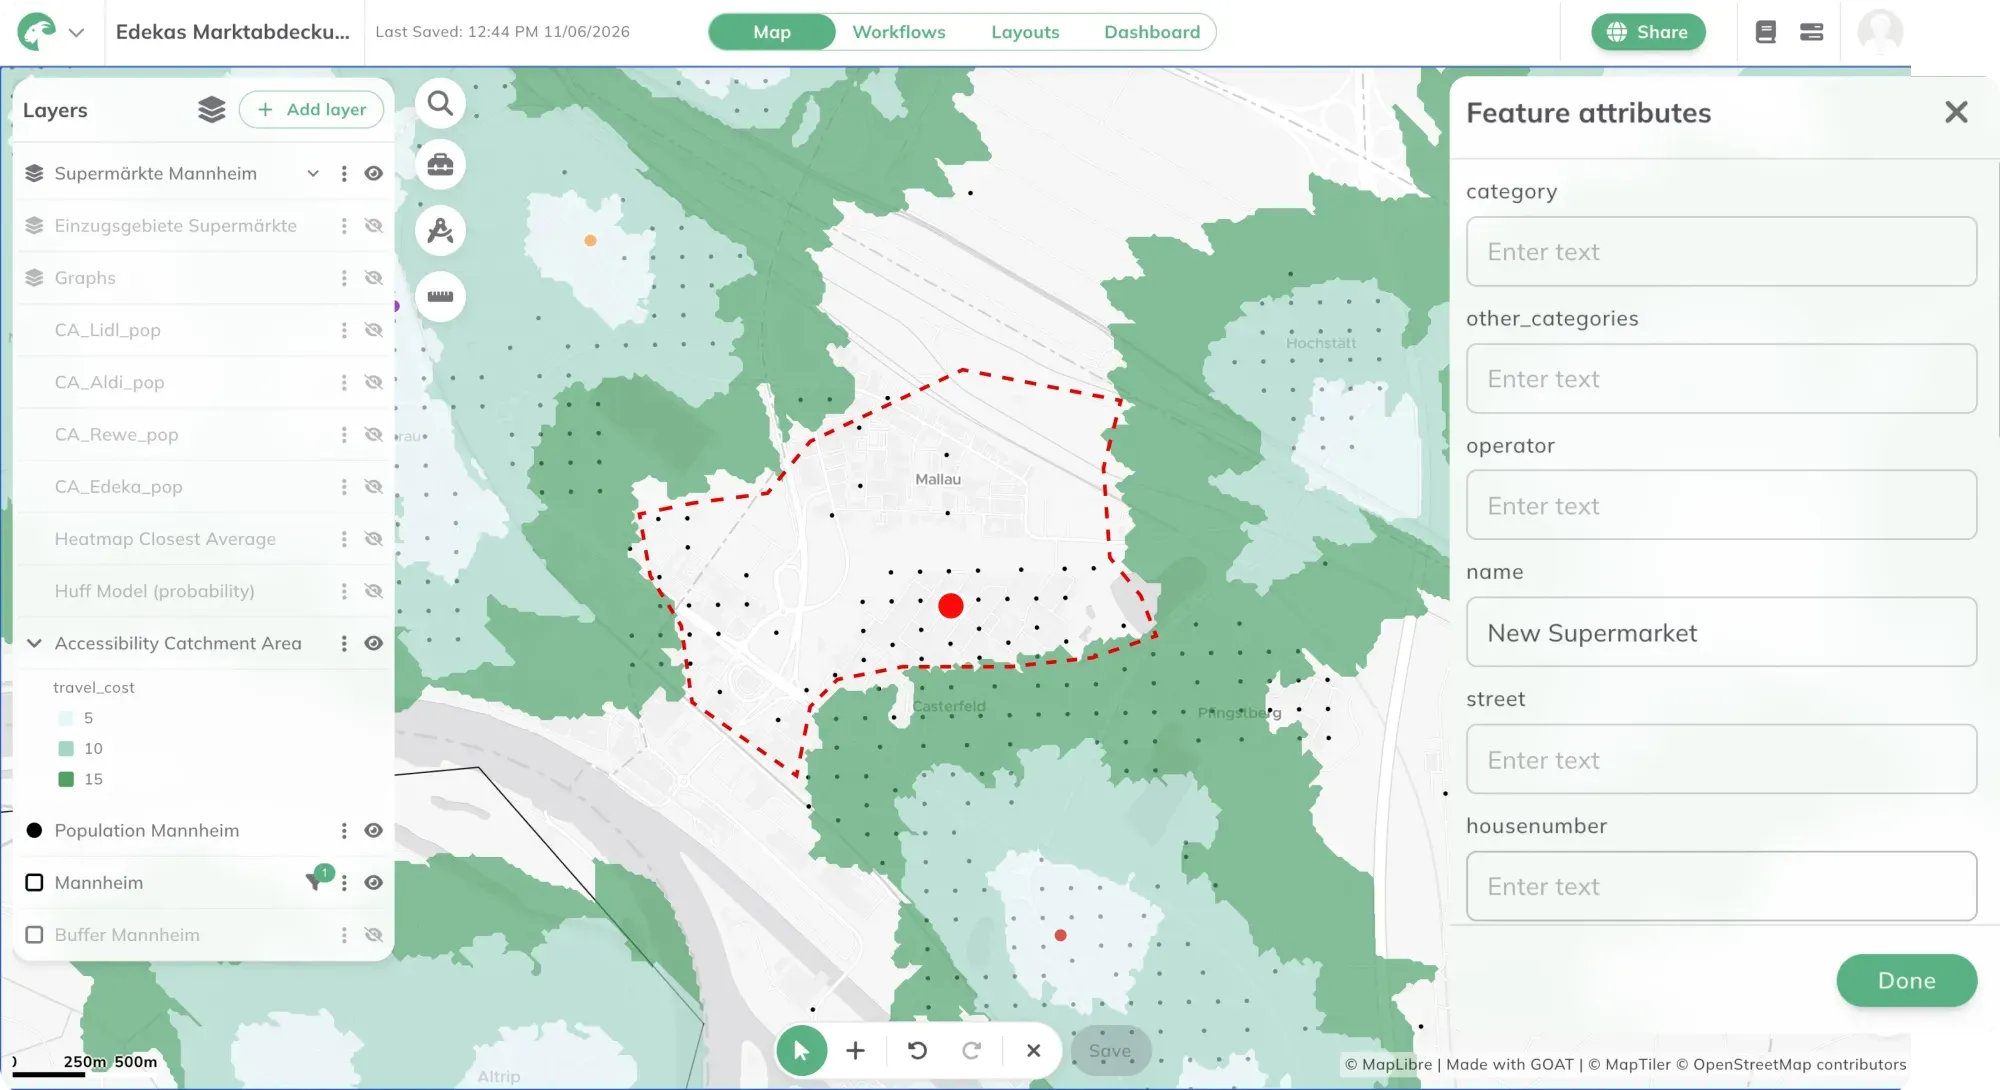
A radius does not show who is served
Whether a neighbourhood has shops nearby is often decided with a circle drawn around the nearest store. If a home is inside the circle, it counts as served. A railway line without a crossing, a wide main road or a river does not appear in that calculation. For someone who shops on foot, those barriers decide how long the walk is.
For everyday shopping, walking is the only option for many people: older residents, for example, and households without a car. An ageing population, rising mobility costs and the concentration of food retail make it more urgent to know which neighbourhoods are losing their local store, and which never had one.
In Germany, many municipalities steer retail development with a retail and centres strategy (Einzelhandels- und Zentrenkonzept). It sets out where new retail should go, defines the central shopping areas the municipality wants to protect, and feeds into land-use planning. For the strategy to hold, it needs clear evidence: who can reach which store, where a store is missing, and what a new or closed store would change. A radius cannot answer these questions reliably.
How we analyse access to retail
The method is an accessibility analysis with shops as the destinations. It starts with a definition of what counts as served: which shops count, by which mode, and within what time. That definition drives the result. A 10-minute walk gives a different map from a 15-minute walk, and both can be justified, so the threshold is always part of the result. Our glossary explains what makes a service gap.
Next, we calculate the catchment area of every store along the street network, on foot, by bicycle, by car or by public transport. Combined with population data, it shows how many people can reach a store in the chosen time and how many cannot. A supply gap is then a specific area with a known number of residents.
A heatmap gives the full picture. It shows the travel time to the nearest stores for every grid cell, or gives larger stores more weight than small ones. This makes thin coverage visible even inside areas that a radius would count as served.
Where several stores compete for the same residents, the Huff model estimates the share of demand each one attracts. It uses the attractiveness of each store, such as its sales floor area, and the distance to it.
Finally, we run scenarios. A planned store is added or an existing one removed, and the result is compared with today. You see how many more people a new site would serve, and who loses access when a store closes.
Retail analysis in GOAT
In GOAT, the tools are under Accessibility Indicators. Catchment Area calculates isochrones for Walk, Bicycle/Pedelec, Car and Public Transport, with time steps you choose yourself, such as 5, 10 and 15 minutes. Heatmap - Closest Average shows the average travel time to the nearest stores. Heatmap - Gravity weights stores by Destination Potential, for example by sales floor area. Huff Model calculates the share of demand each competing store attracts. The GOAT documentation explains each setting.
Add store locations, population data and administrative boundaries to your project from the Catalog, or upload your own data, such as your own survey of stores. You can save the steps as a Workflow. When a store opens or closes, run the analysis again with the same method.
For the City of Bonn, we are building a retail planning application on GOAT, embedded in the city’s Urban Data Platform. It is designed to run accessibility analyses, a local supply review scheme and forecasts automatically. In Freiburg, the city planning office and the local transport operator VAG have used GOAT on a subscription since 2022, including to review the city’s retail strategy.
You can run the analysis yourself in GOAT, or ask us to do it for your municipality. The projects are listed directly below.
From our projects
- Retail
- Cities & Government
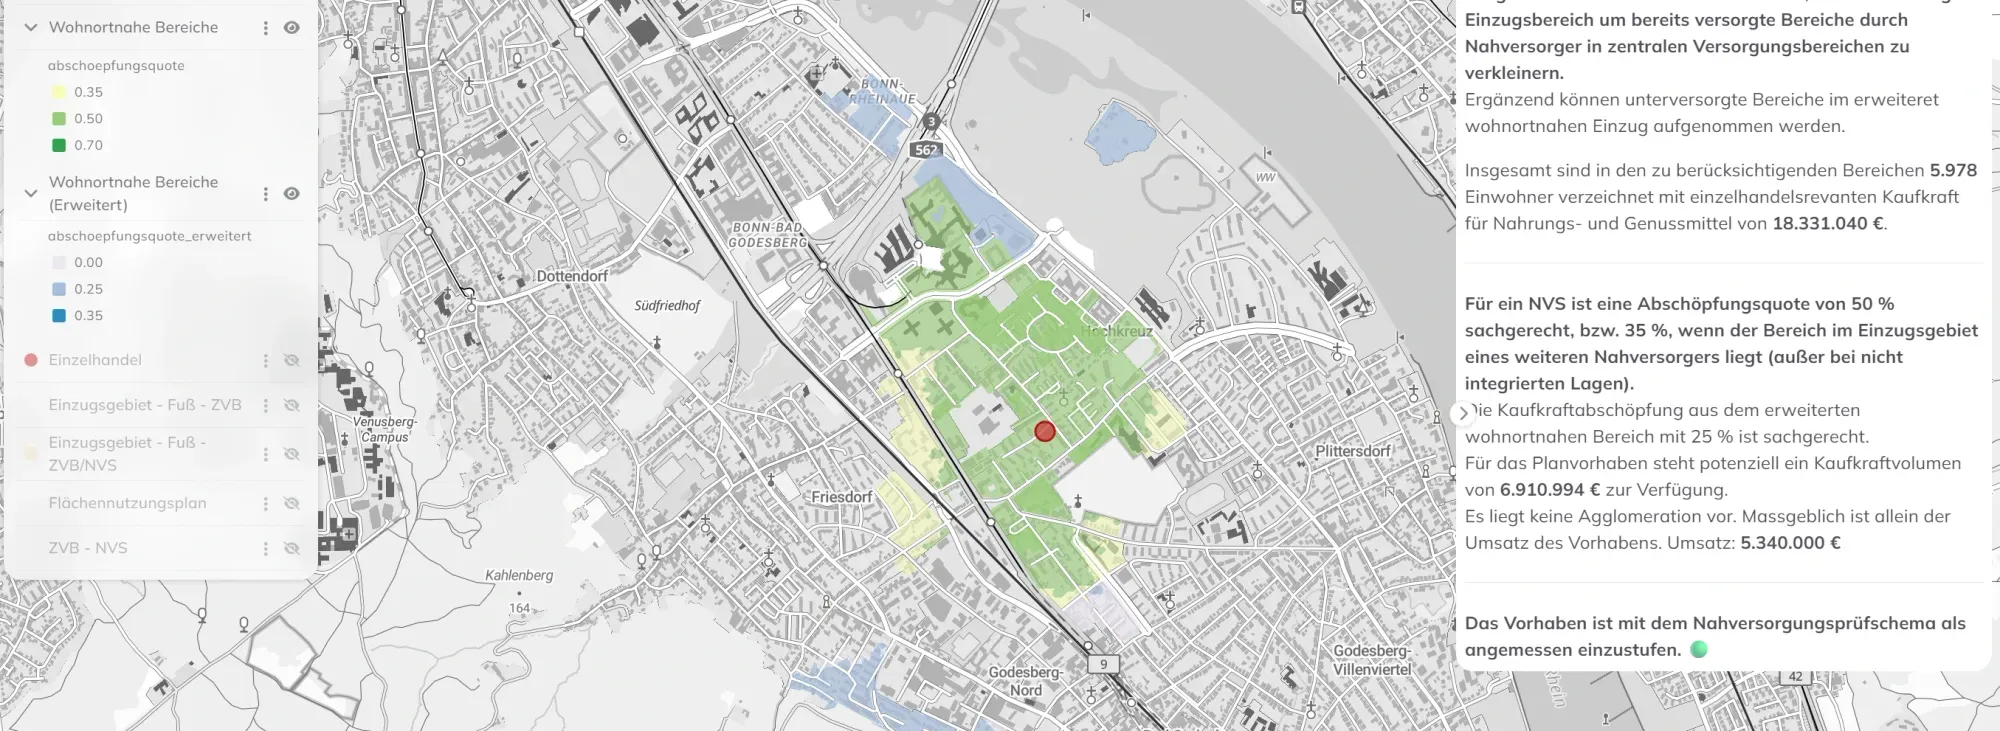
Retail planning in Bonn: data-driven GIS analysis with the WebGIS GOAT
Plan4Better is developing a GIS-based retail planning tool for the City of Bonn — enabling automated accessibility analyses, local supply assessments, and data-driven decisions fully integrated into the Urban Data Platform.
Read the reference
- Cities & Government
- Mobility Planning
- Retail
Freiburg - GOAT Subscription
With the GOAT subscription, planners from the City of Freiburg and the local transport provider produce accessibility analyses for a wide range of planning issues.
Read the reference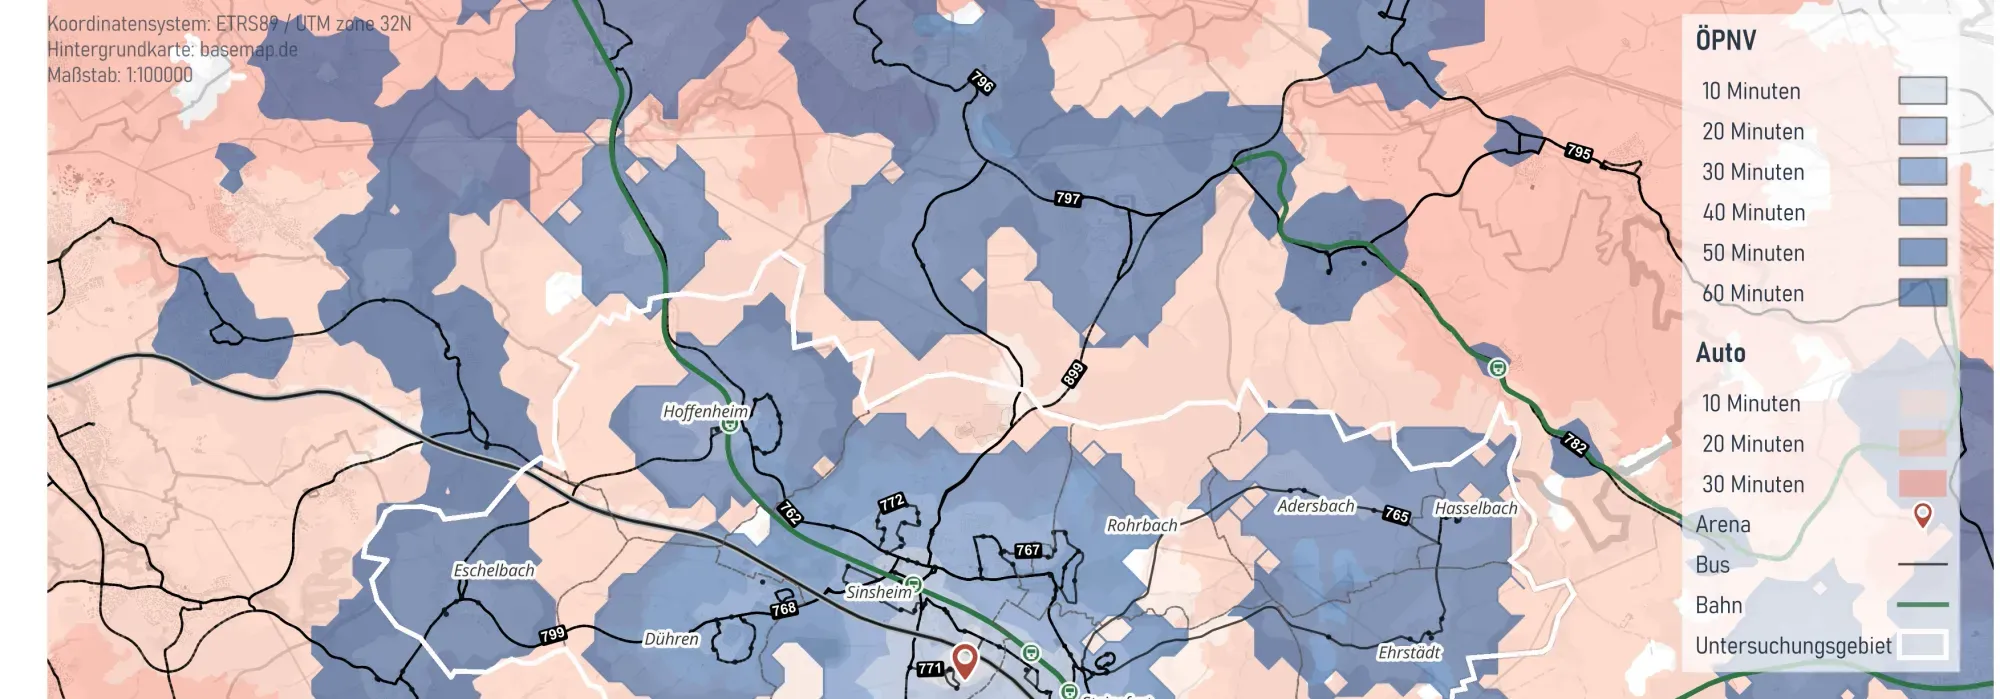
- Cities & Government
- Mobility Planning
Integrated Mobility Analysis for the City of Sinsheim
The City of Sinsheim commissioned Plan4Better to carry out an integrated mobility analysis of cycling, walking and public transport to reduce the high dependency on private motor traffic and identify improvement potentials for the city’s various transport modes.
Read the reference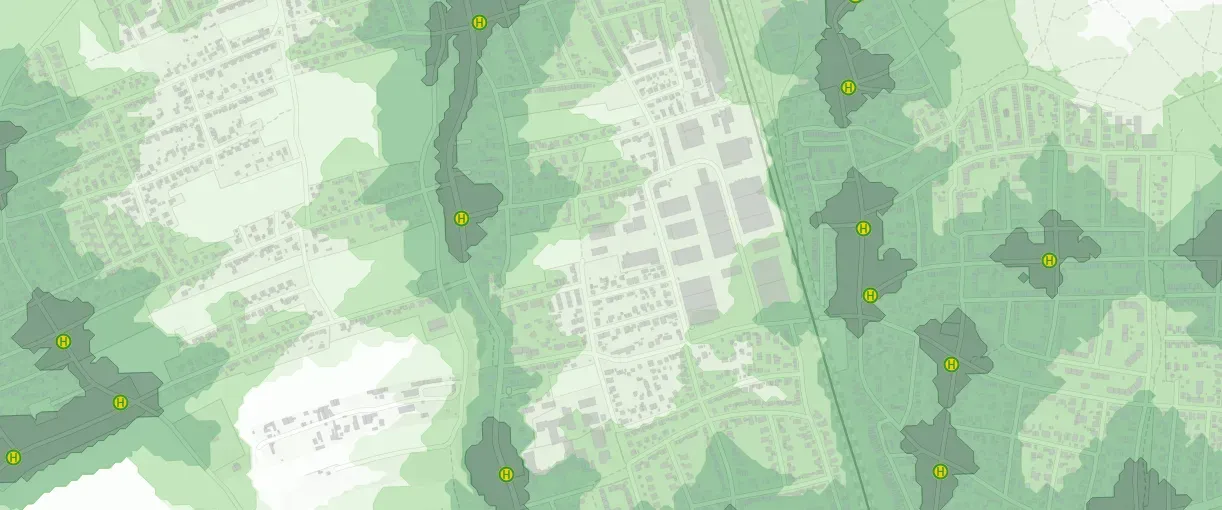
- Cities & Government
- Mobility Planning
Active mobility concept for the Munich district of Allach-Untermenzing
The active mobility concept for Allach-Untermenzing combines detailed data analysis with active citizen participation to develop sustainable, tailored mobility solutions that directly address the everyday needs of local residents.
Read the reference
Frequently asked questions
What does an accessibility analysis for retail show?
It shows how well residents can reach shops, from grocery stores for everyday needs to larger retail locations. Travel is measured along the real street network, on foot, by bicycle, by car or by public transport. The result shows each store's catchment area, where people live with no store within reach, and how many of them there are.
Is this the same as a food desert analysis?
It covers the spatial part of one. A food desert usually also means that the food on offer is unaffordable or unhealthy, and an accessibility analysis does not measure price or diet. What it does show is where people cannot reach a grocery store in a reasonable time.
What walking time counts as local access to a grocery store?
There is no single standard. German retail strategies often work with 10 to 15 minutes on foot, or with a distance of a few hundred metres up to about one kilometre. The threshold decides the result, so it should always be stated with the map. In GOAT, you set the time steps yourself.
What data do you need?
Store locations, ideally with sales floor area, population data such as the 100-metre grid of the 2022 German census, and a street network. Population data, points of interest and street networks are available in the GOAT catalog, and you can upload your own survey of stores as well.
Can I test what a new store would change?
Yes. Add the planned site and calculate the catchment areas and heatmap again. Comparing the result with today shows how many more people have a store within reach. The Huff model also estimates how demand would split between the new store and the existing ones.
Working on a retail or local supply strategy?
Book a slot and we will look at access to retail and the supply gaps in your municipality together.
- Catchment areas of shops and retail centres on foot, by bicycle, by car and by public transport.
- Supply gaps: where residents have no store for everyday needs within reach, and how many of them there are.
- Competition between stores, estimated with the Huff model.
- Scenarios for new, relocated or closed stores.
- Maps and figures you can use directly in your strategy document.
Ready to make sense of your data?
Join planners, organizations and cities using GOAT to make better decisions, faster. No GIS expertise needed.