
Straight line, walking route or quality class: how 173 German transport plans measure access to public transport
When does a place count as served by public transport? We analysed 173 German local public transport plans. Most of them only measure the distance to the nearest stop, and only a few also look at the service at that stop. Using Wiesbaden as an example, we show how much the result depends on the method.

When does a place count as served by public transport? Every German local public transport plan (Nahverkehrsplan) answers this question, and the answers differ more than you might expect. In many plans, a neighbourhood counts as covered if a stop is no more than 300 metres away in a straight line, even if a bus stops there only twice a day. Other plans only count a stop if it has a minimum level of service. A few measure the real walking route and the frequency.
We analysed 173 local public transport plans from across Germany: how they measure access, and whether the level of service plays a role. We then used Wiesbaden as an example to show how much the result depends on the method.
Which method a plan uses depends a lot on where it is made. The type of area mainly sets the values: just over half of the plans use different radii for central, dense and rural areas, and the smallest radius is on average 300 metres in cities and 350 metres in rural districts. The federal state and the rules of the state and the transport association mainly set the method. In Bavaria, 20 of 21 plans follow the state guideline of 1998 and only measure distance. In Baden-Württemberg, Hesse and Rhineland-Palatinate, about 40 to 50 percent of the plans link access to the service at the stop. And in rural districts, especially in Lower Saxony, Thuringia and Brandenburg, there is often no radius at all: the plans check whether each place has enough trips.
What the guidelines say
There is no binding standard in Germany. The values in the plans come from recommendations. These are the most common ones:
| Area | Bus and tram | Rail |
|---|---|---|
| Central areas of larger towns | 300 m | 400 m |
| Areas of high density | 400 m | 600 m |
| Areas of low density, smaller municipalities | 600 m | 1,000 m |
Catchment areas as straight-line distance according to VDV Schrift 4 (2019). An area usually counts as covered if 80 percent of its residents live within this radius.
Other guidelines and studies measure differently. The most important ones for Germany and its neighbours:
| Source | What it sets or shows |
|---|---|
| FGSV, recommendations for planning and operating public transport (2010) | Straight-line radii by type of area, with a detour factor of about 1.2 for walking |
| Bavarian guideline for local transport planning (1998) | Target and limit values, in central areas 300 and 400 m for bus and tram |
| BBSR, Analysen kompakt 08/2018 | 92 % of people live within 600 m in a straight line of a stop, 88 % of a stop with at least 20 departures per weekday |
| ARE, public transport quality classes in Switzerland (2022) | Classes A to D from frequency and straight-line distance up to 1,000 m |
| ÖROK, public transport quality classes in Austria (2022) | Classes A to G from frequency and real walking distance up to 1,250 m |
| KCW and RWTH Aachen University for the Federal Ministry of Transport (2024) | Proposal: combine departures per hour with walking distance, levels A to H |
The most recent study, by KCW and RWTH Aachen University, is meant to prepare national standards. It finds that plans usually look only at the distance to a stop, regardless of how often services run there, and it considers the straight-line distance not accurate enough. Its proposal is close to the Swiss and Austrian quality classes, but it is not yet a standard.
What 173 transport plans actually do
For this analysis we used our knowledge base. It collects planning documents from across Germany, now including about 200 local public transport plans. Here we used only the current plan of each public transport authority and left out partial updates and the state plans for rail. This leaves 173 plans. A language model asks each plan the same question and returns the answer with a page reference. We checked the results for individual plans in the original documents, and where the knowledge base found no rule, we searched the full text ourselves.
Almost all plans define when an area counts as covered. Most of them do this through the walk to the stop. A smaller group, almost only rural districts, checks each village or town instead: whether it has a stop, how many trips there are, or how quickly people can reach the nearest central town. This gives the following groups:
| Group | Plans | How access is measured | Examples |
|---|---|---|---|
| Distance only | 113 | A radius around every stop, however often services run there | Bayreuth 2025: 300 m bus, 600 m rail |
| Minimum service as a threshold | 27 | A stop only counts above a minimum level of service | Hohenlohekreis: 2 departures a day; Esslingen and Göppingen: 15 trips per weekday; Offenbach: a bus every 30 minutes |
| Graded by service | 11 | The more frequent the service, the further away a stop may be and the better the class | Wuppertal 2023, Wiesbaden 2024, Schleswig-Holstein 2026 |
| Service per place | 19 | No radius: each place above a certain population needs a stop, a minimum number of trips, or a connection to the nearest central town | Uelzen: 3 to 12 round trips per place; Dahme-Spreewald: regional centre within 60 minutes |
| No rule | 3 | The plan sets service and quality standards, but not access |
Analysis of 173 local public transport plans in the Plan4Better knowledge base, November 2026.
The differences between federal states often go back to shared rules. The Bavarian plans take over the target and limit values of the state guideline. In the Stuttgart transport association (VVS), a rule for the whole association says that a stop only counts fully with at least 15 services per weekday. Plans in the Rhine-Neckar transport association (VRN) state, in almost the same words, that access is only ensured with a minimum service. The Schwarzwald-Baar district uses the public transport quality classes that the state of Baden-Württemberg published in its 2024 public transport report.
Almost all plans measure the way to the stop as a straight line. Only a handful use real walking routes along the street network.
Public transport quality classes are new in Germany. All eight plans that use them are from the last three years:
| Year | Local public transport plan |
|---|---|
| 2023 | Wuppertal, Gießen |
| 2024 | Wiesbaden and the Rheingau-Taunus district |
| 2025 | Hanau, transport association of southern Lower Saxony with Göttingen |
| 2026 | Schwarzwald-Baar district, Main-Tauber district, state plan for Schleswig-Holstein 2027 to 2031 |
For Schleswig-Holstein, we calculated the quality classes ourselves on behalf of NAH.SH.
What the method changes: the example of Wiesbaden
Wiesbaden changed its method and explains this in its plan. In 2015, the walk to the stop was still measured “as a straight-line distance in the form of radii (300 m)”. According to the new plan, this does not reflect that detours and topography vary a lot from place to place, which matters in a city with many hills. The 2024 plan therefore routes every trip along the real street and path network and groups access into quality classes from A to G.
We recalculated the difference with open data in GOAT WebGIS: 443 stops with weekday services and their 871 stopping points, and residents from the 100-metre grid of the 2022 census. We used three methods: 300 metres in a straight line, 300 metres on foot along the street network, and public transport quality classes, also based on real walking routes.
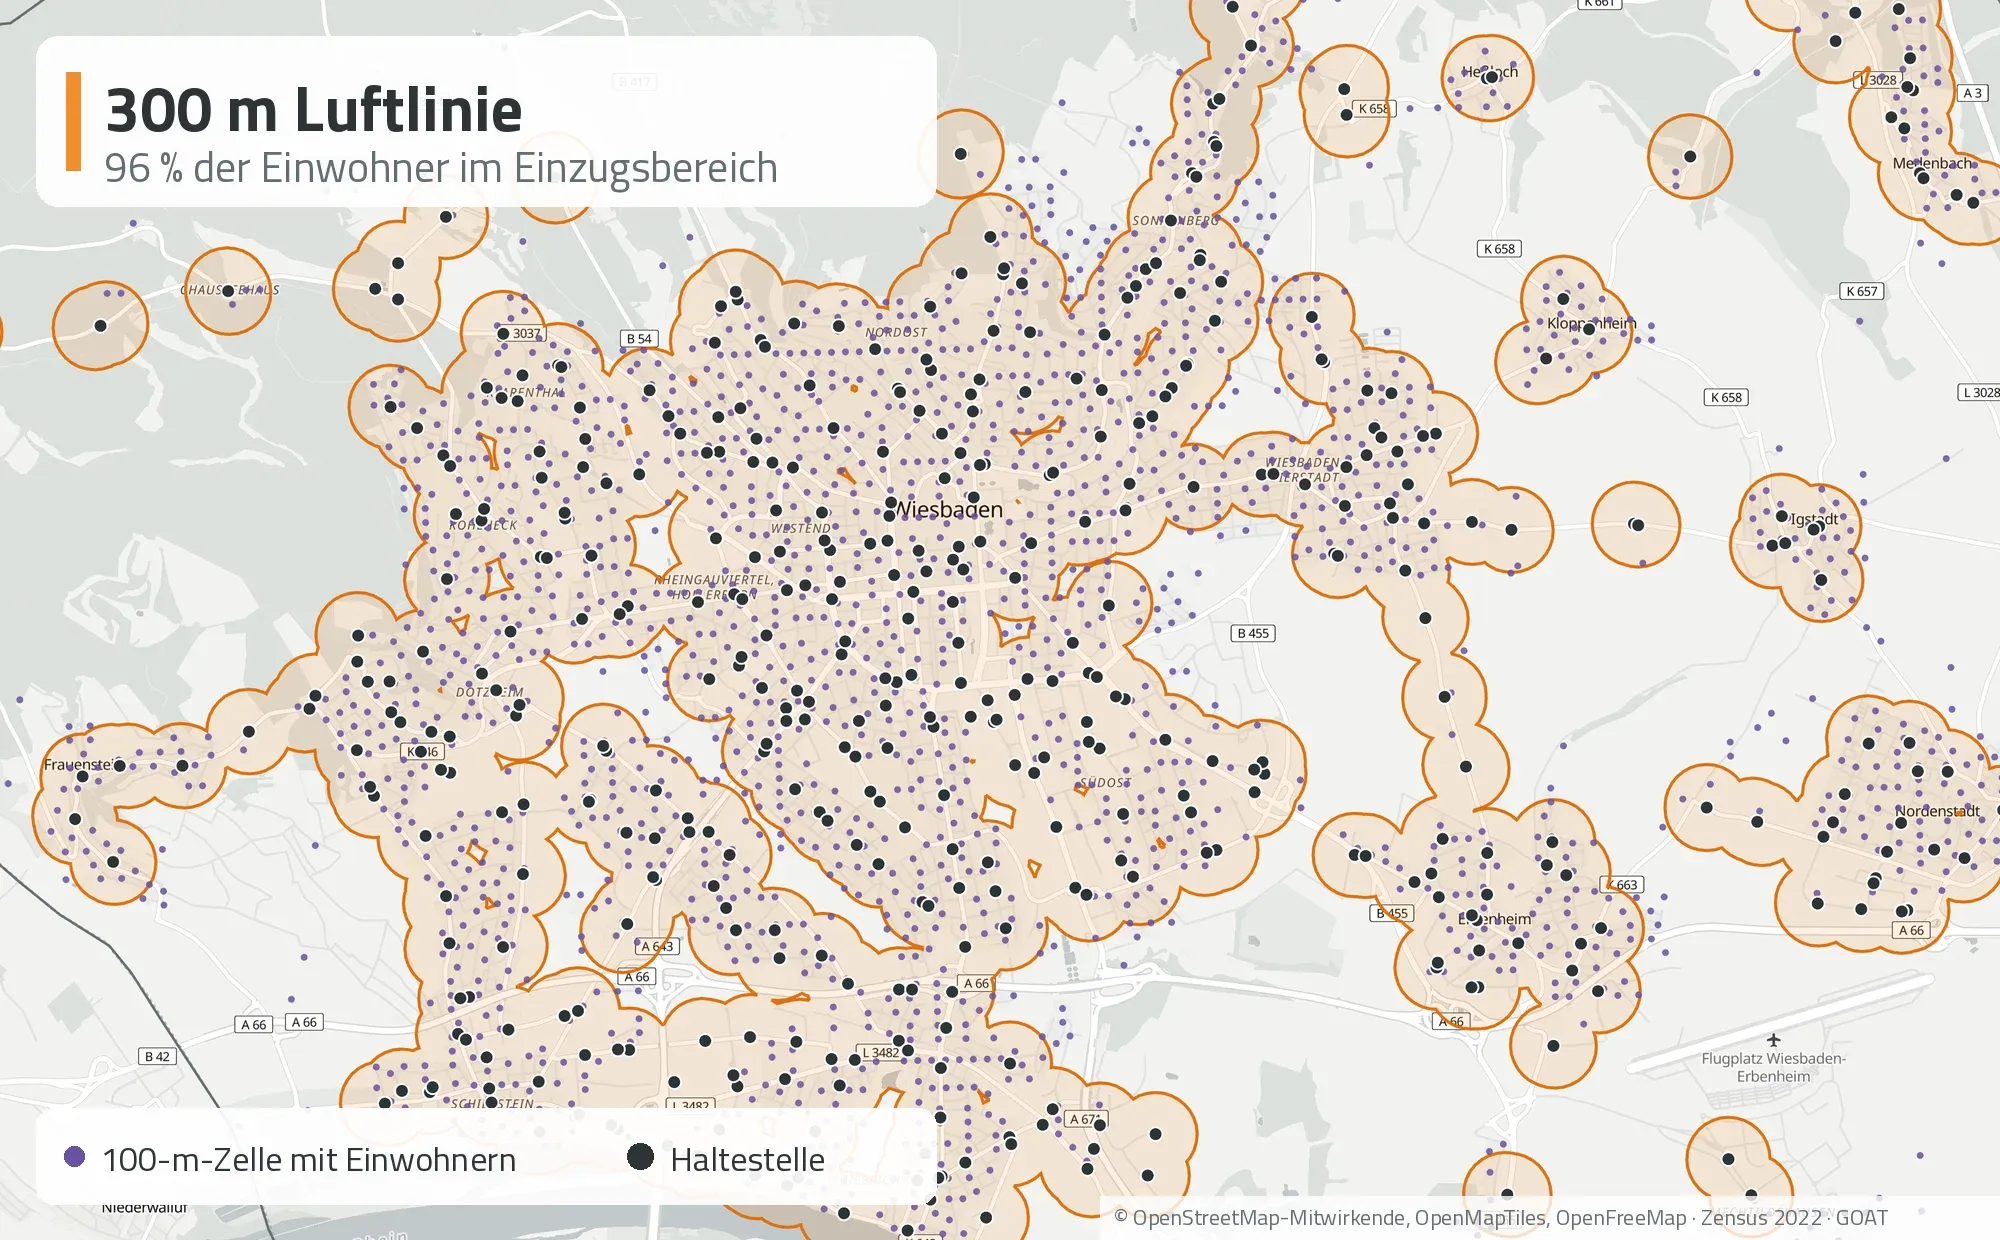
300 metres in a straight line around each stop. Purple dots: inhabited 100 metre cells from the 2022 census.
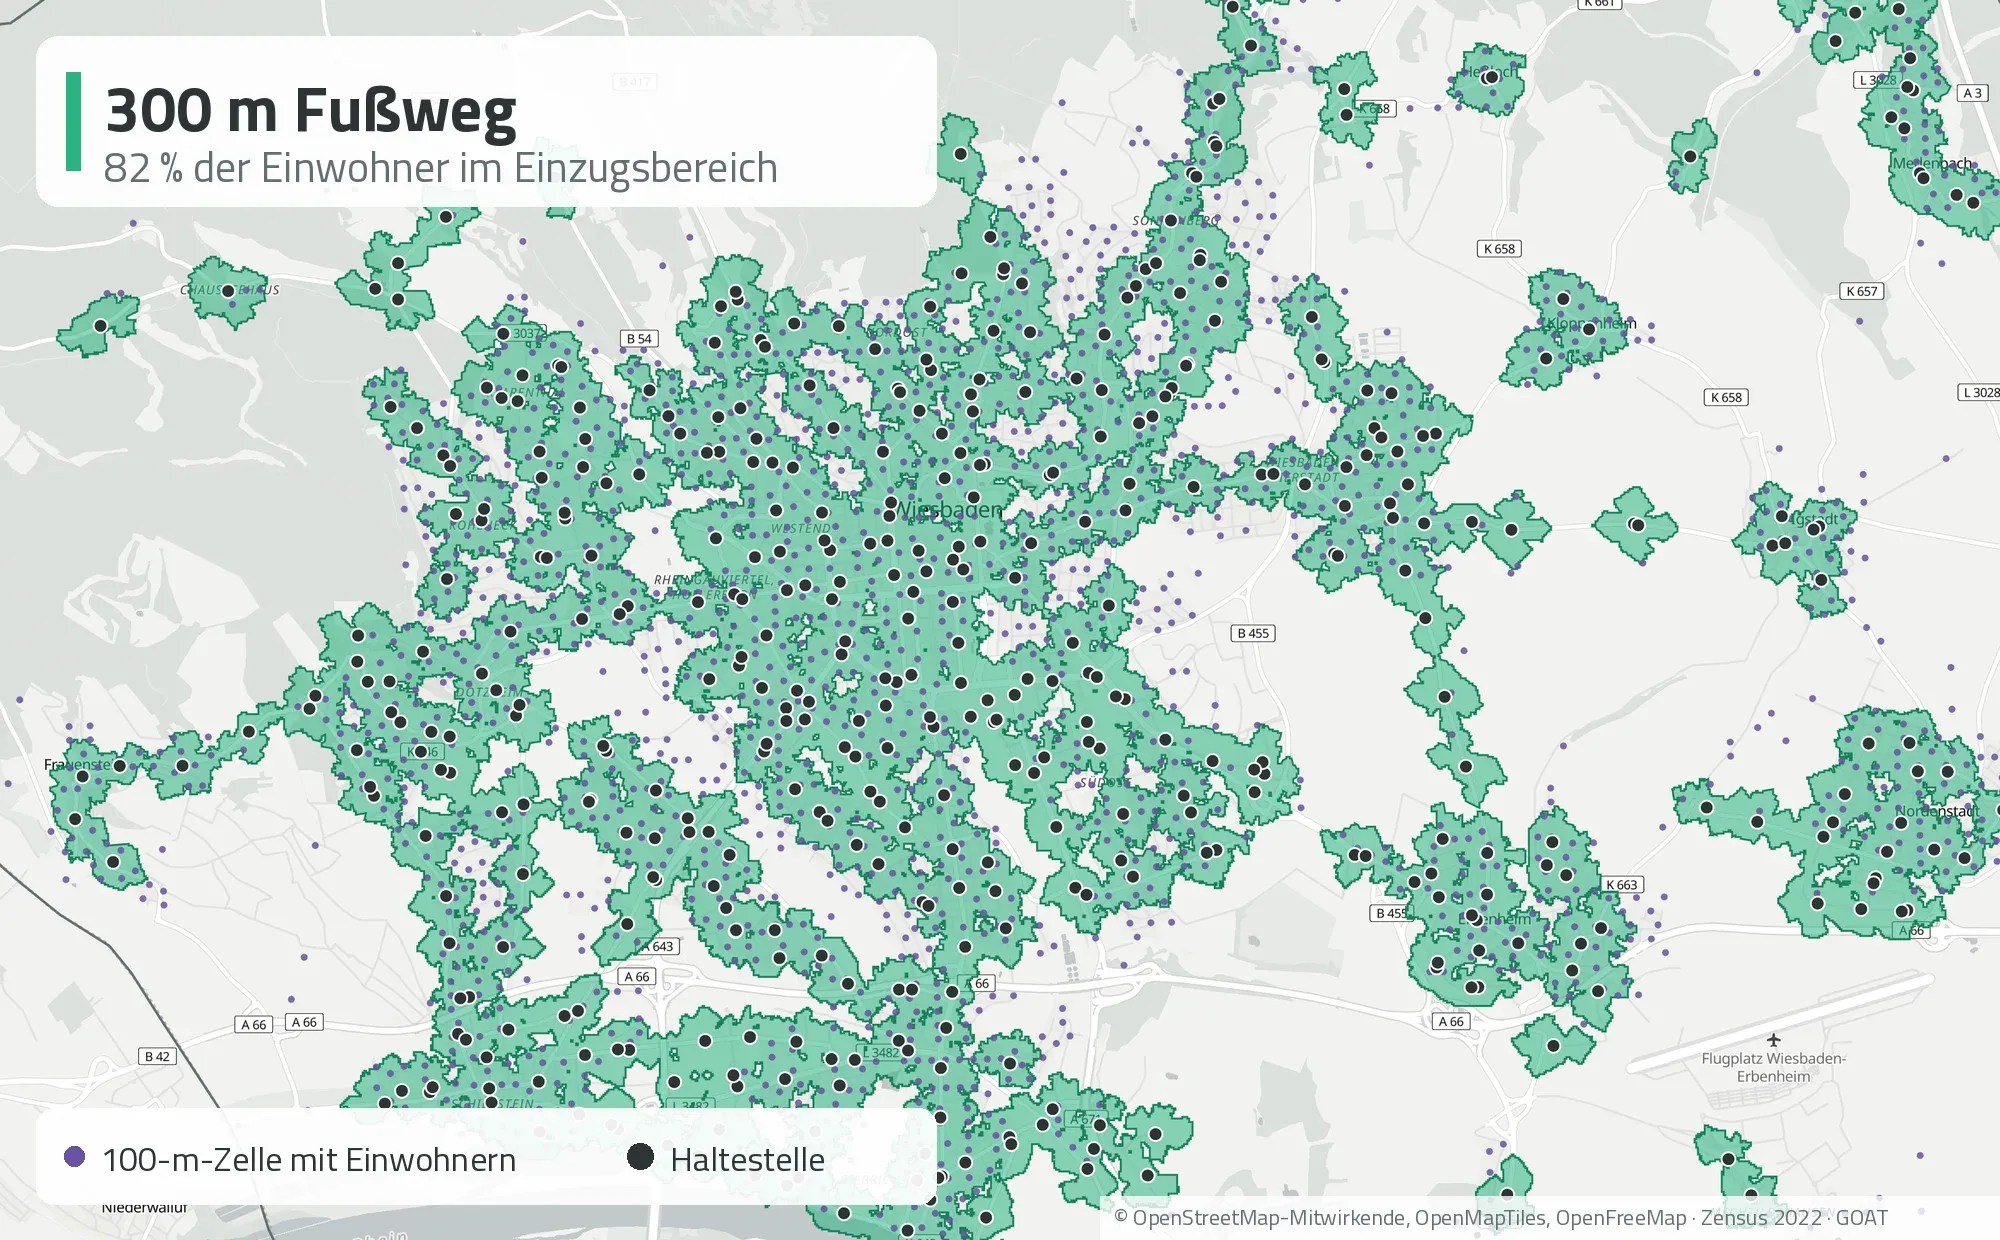
300 metres on foot along the street network. Purple dots outside the green areas are inhabited cells without a stop within walking distance.
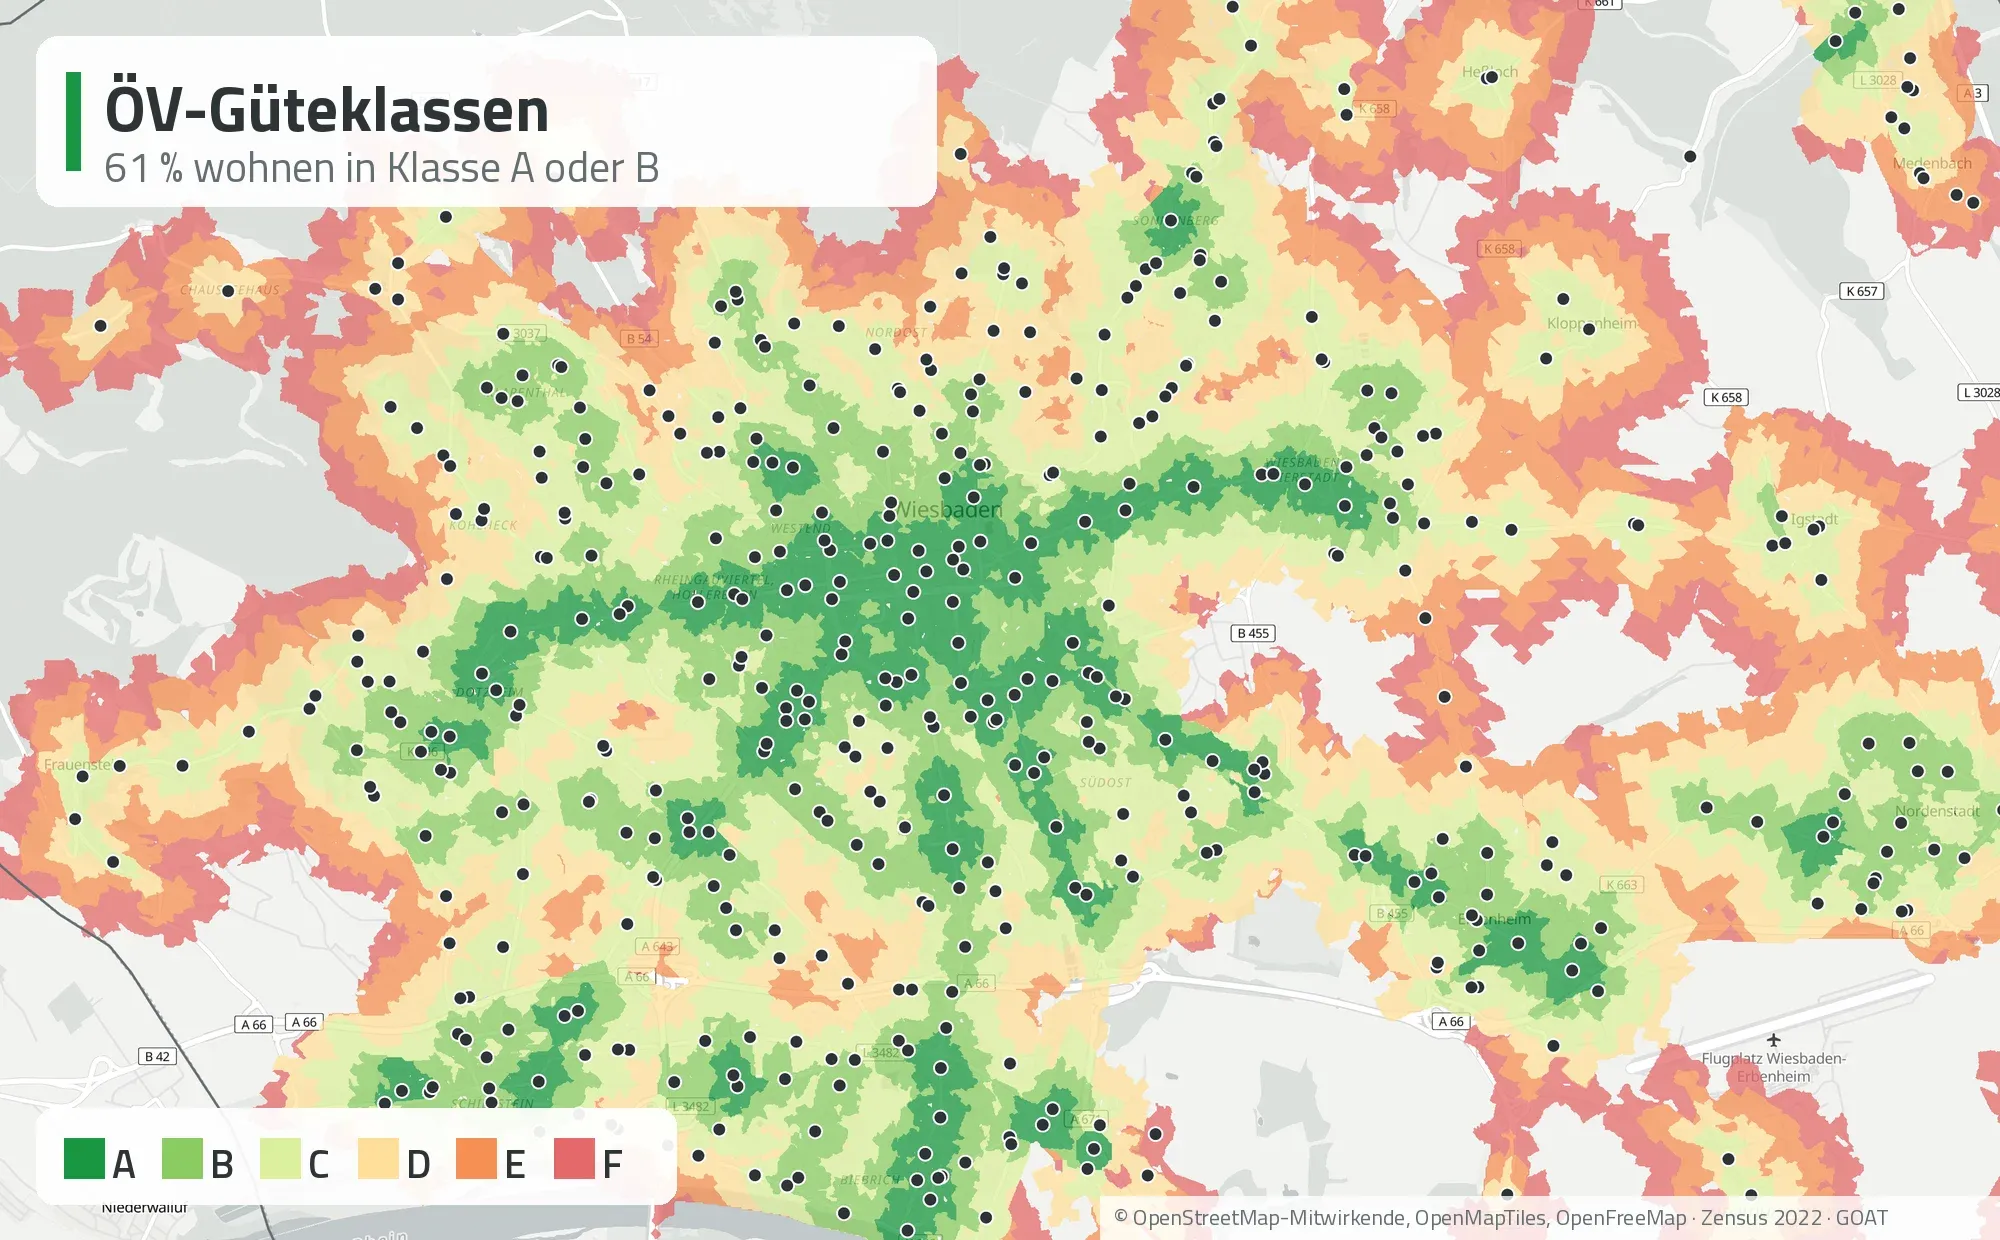
Public transport quality classes for weekdays from 6 am to 8 pm, with walking routes along the street network. The labels in the maps are in German.
| Method | Residents within the catchment area | Share |
|---|---|---|
| 300 m straight line | 274,000 | 96 % |
| 300 m walk | 233,000 | 82 % |
| Quality class A or B | 172,000 | 61 % |
With the straight line, 96 percent of residents count as covered. With the walking route, it is 82 percent. The difference is about 41,000 people. In the city centre the difference is small, because the stops are close together. It appears at the edges: where a railway embankment, a park or a slope lies between two stops, and in the outer districts, where a stop stands on its own.
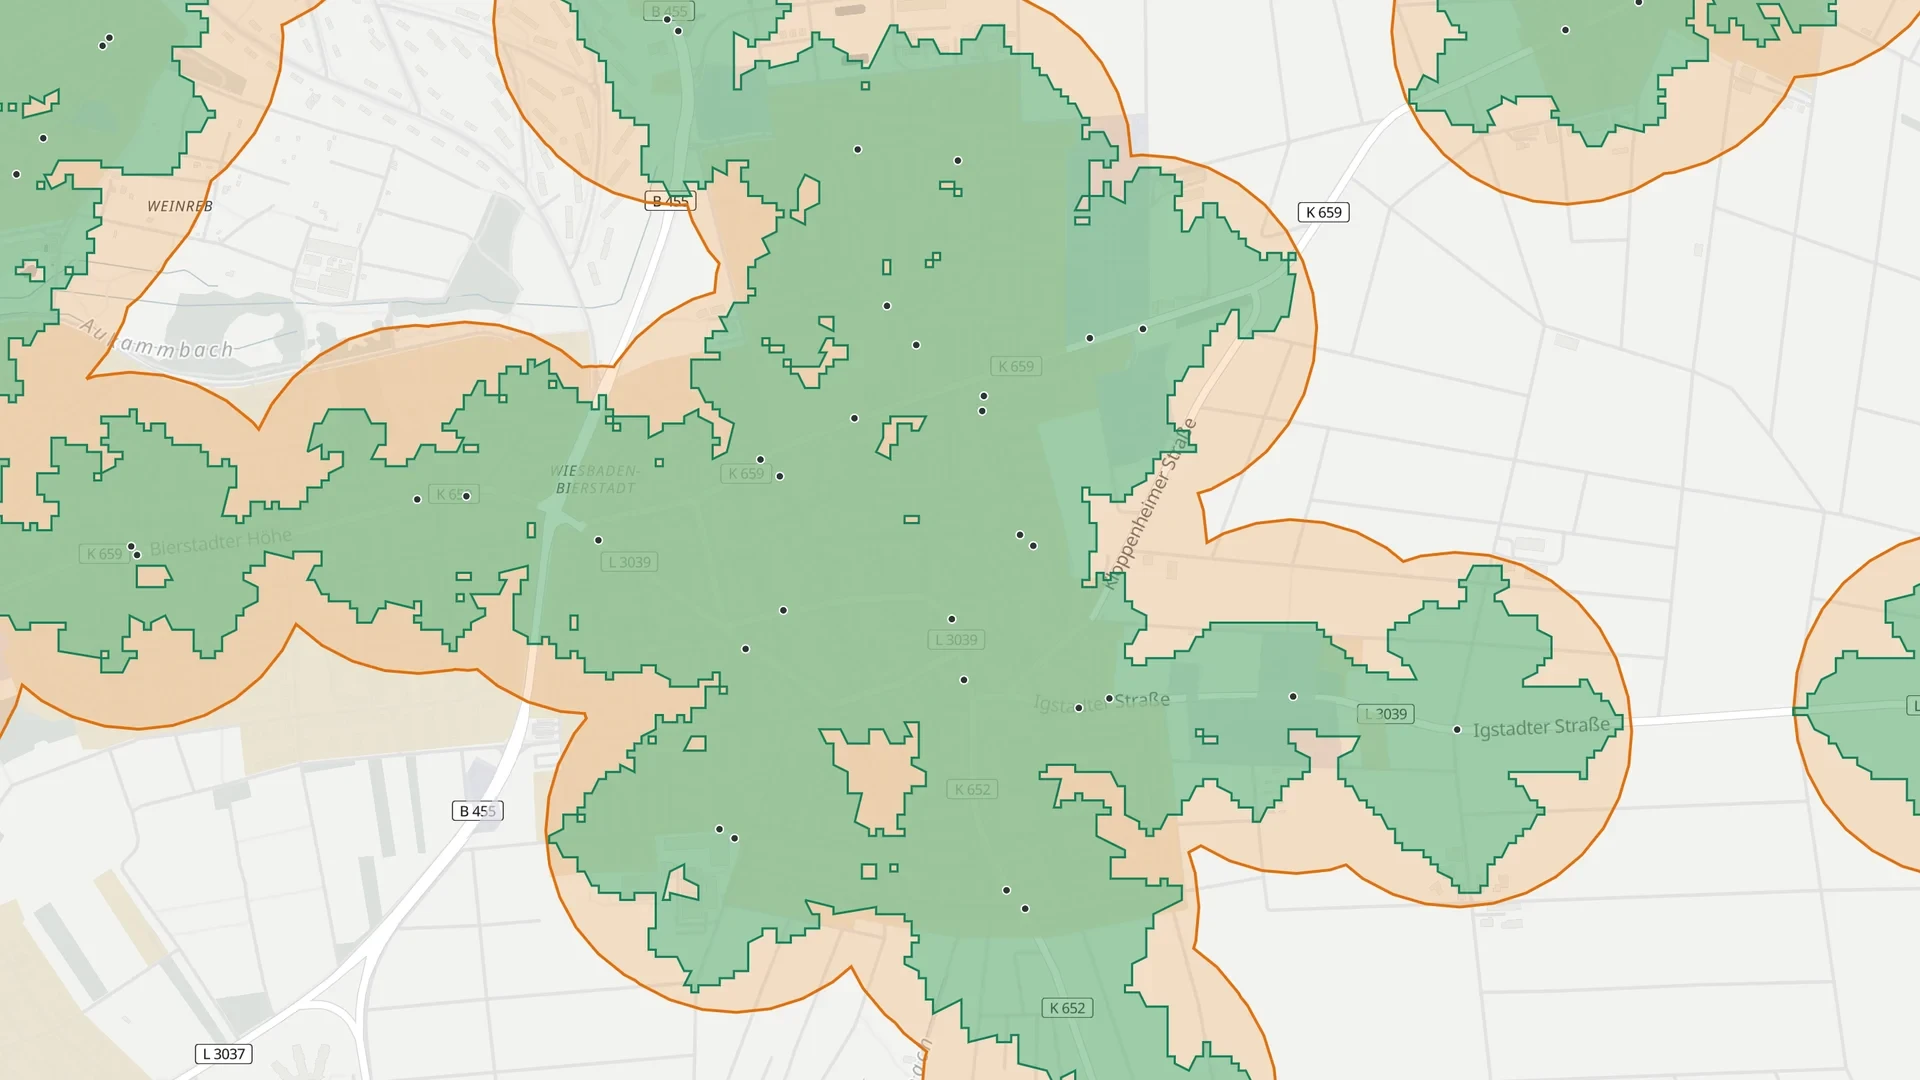
Wiesbaden-Bierstadt: first the circle, then the area inside the circle that is more than 300 metres away on foot, then the walking route, and finally the quality classes. The labels in the clip are in German.
The quality classes also take the service into account. A quarter of Wiesbaden’s residents live in class A, close to stops with very frequent services, and 61 percent in class A or B. The city centre and the main corridors are very well served, the outer districts in the north and east much less so. Our classes follow the Swiss method and cannot be compared directly with those in the transport plan, which calculates individual trips in even more detail. The direction is the same, though: Wiesbaden writes that with the more precise method, the quality of access is “on average worse”, but the result is more accurate.
A more precise method does not make the numbers look better. It shows where the gaps really are.
What this means for the next update of a plan
Many local public transport plans will be updated in the next few years. If you change the method, you should know beforehand how the numbers will shift, so that a lower value is not read as a worse service.
The effort has become much smaller. Timetable data is openly available as GTFS, the street network comes from OpenStreetMap, and residents from the census grid. For a city the size of Wiesbaden, each of the three variants can be calculated in GOAT in less than a minute. The same approach also shows what a new line or a more frequent service would mean for access before it goes into the plan.
See it live in our webinar
On 24 November at 13:30 CET we show in one hour what the guidelines say, how the transport plans apply them, and calculate the three methods live in GOAT. The webinar is in German. Participation is free, and participants who write to us afterwards get an extra free month of GOAT.
How the quality classes are calculated and how well municipalities in Germany are served is explained in our white paper on public transport quality.
Data and method
- Transport plans: 173 plans from the Plan4Better knowledge base, the current plan of each public transport authority, without partial updates and without the state plans for rail. A language model asked each plan the same question and returned the answer with a page reference. We checked individual results in the original documents.
- Stops: national timetable in GTFS format, September 2026. Only stops with weekday departures, each stopping point counted separately.
- Residents: 2022 census on a 100-metre grid. A cell counts if its centre lies within the catchment area.
- Walking: 300 metres walking distance from each stopping point along the GOAT street and path network.
- Quality classes: weekdays from 6 am to 8 pm, walking routes along the street network, calculated in GOAT.
- Maps: © OpenStreetMap contributors, OpenMapTiles, OpenFreeMap.
Sources
- BBSR (2018). Angebotsqualitäten und Erreichbarkeiten im öffentlichen Verkehr. BBSR-Analysen KOMPAKT 08/2018. bbsr.bund.de
- Swiss Federal Office for Spatial Development ARE (2022). ÖV-Güteklassen. Berechnungsmethodik ARE. Bern.
- FGSV (2010). Empfehlungen für Planung und Betrieb des öffentlichen Personennahverkehrs. Cologne.
- KCW GmbH and ISB RWTH Aachen University (2024). Methodik und Empfehlungen zur Entwicklung bundeseinheitlicher Standards für das ÖPNV-Angebot. Final report for the Federal Ministry of Transport. Quotes from pp. 56 and 77. fops.de
- City of Wiesbaden and Rheingau-Taunus district (2024). Gemeinsamer Nahverkehrsplan Wiesbaden & Rheingau-Taunus-Kreis, Teil A. Quotes from pp. 84 and 90, our translation. rheingau-taunus.de
- ÖROK (2022). ÖV-Güteklassen. ÖROK-Materialienreihe Heft 10. Vienna. oerok.gv.at
- Bavarian State Ministry for Economic Affairs, Transport and Technology (1998). Leitlinie zur Nahverkehrsplanung in Bayern. Munich.
- Statistical Offices of the Federation and the Länder (2024). Zensus 2022: population on a 100-metre grid. zensus2022.de
- VDV (2019). Verkehrserschließung, Verkehrsangebot und Netzqualität im ÖPNV. VDV-Schrift 4. Cologne.
Frequently asked questions
What does access to public transport mean in a German transport plan?
German local public transport plans (Nahverkehrspläne) define a catchment area around each stop, for example 300 metres around a bus stop, and a target share, usually 80 percent of residents. An area counts as covered if enough people live within that distance. How often a bus or train runs at the stop is usually a separate question, handled in the service standards.
What radius is used for a bus stop in Germany?
There is no binding national value. The common figures come from recommendations by the FGSV (2010) and the VDV (Schrift 4). Typical values are 300 metres in central areas, 400 to 600 metres in less dense areas and up to 1,000 metres in rural areas. Railway stations get larger catchment areas.
What are public transport quality classes?
Public transport quality classes combine distance and service. Each stop first gets a category from the mode and the frequency of departures. Zones by walking distance are then drawn around it. The result is a set of classes from A, very well served, to F or G, hardly served. The method comes from Switzerland and is also used across Austria. In Germany, eight of the 173 plans in our analysis use it so far.
Is a straight-line radius accurate enough?
It overestimates access, because nobody walks to a stop in a straight line. Detours, railway lines, rivers, slopes and missing paths make the real route longer. In Wiesbaden, about 41,000 fewer people reach a stop within 300 metres on foot than within 300 metres in a straight line. A study for the German Federal Ministry of Transport by KCW and RWTH Aachen University also considers the straight line not accurate enough.
Can I run this analysis for my city or district?
Yes. GOAT WebGIS includes the street network and timetable data for Germany and has tools for buffers, catchment areas and public transport quality classes. For a city the size of Wiesbaden, all three variants take a few minutes. We show this live in our webinar on 24 November.