
The Public Transport Network Explorer in GOAT: what it is and how we built it
GOAT 3.1 added the PT Network Explorer, a way to read a GTFS feed on the map. Here is what it shows, why we built it and how it runs in your browser.

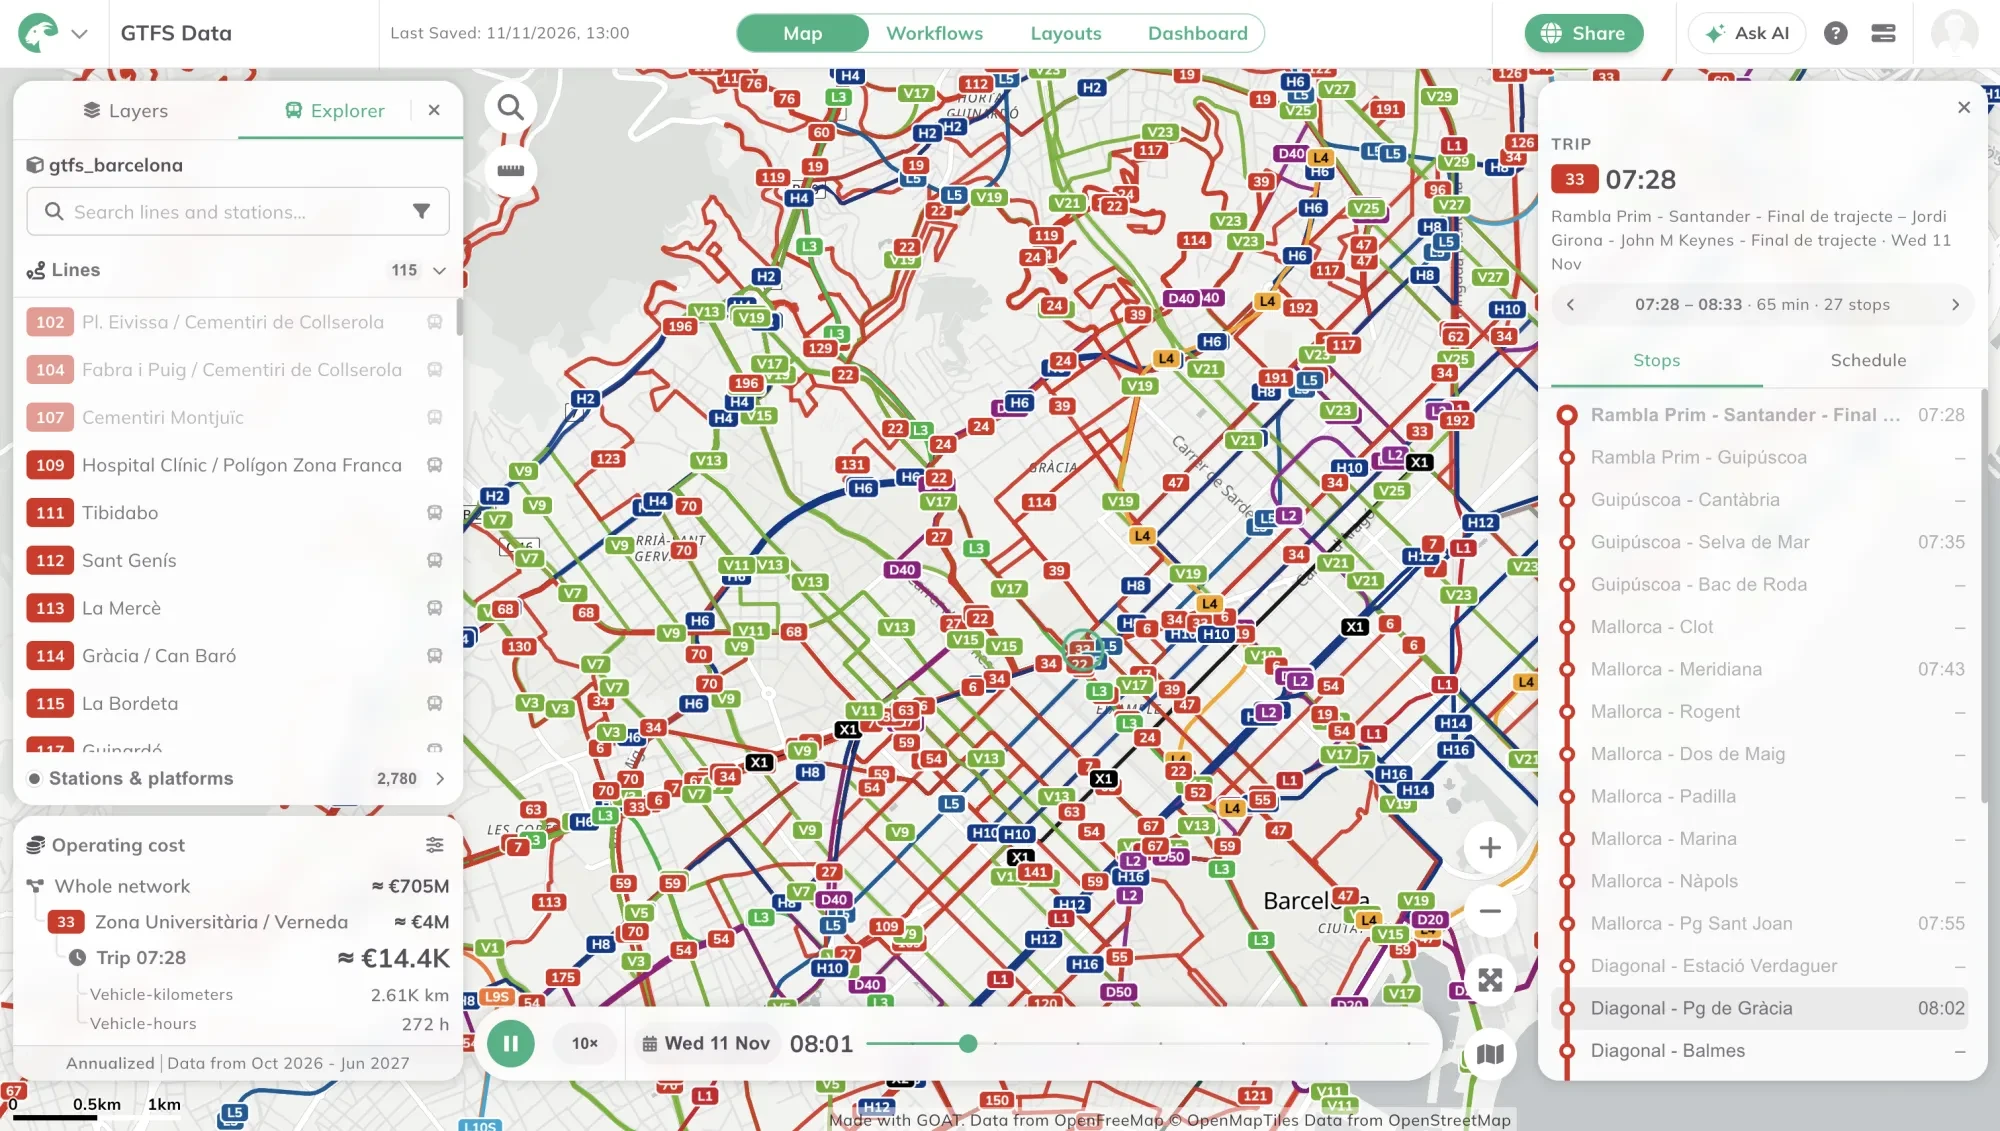
GTFS (General Transit Feed Specification) is the open format transit agencies use to publish their stops, routes and timetables. But opening such a feed usually means opening a folder of text files. Not something a planner can read at a glance. Planners who came to us wanted to see what their network actually does: how often each line runs, what it costs to operate, and who can reach it. So in our latest release, GOAT AI did not come alone. It came with a new tool: the PT Network Explorer.
What does the Explorer show you?
In a few words, the Explorer is a tool in GOAT that lets you dive into your city’s open transit data, laid out in an interface designed for exactly that. It shows lines, stations, trips and the service calendar on the map, with headways, running times and operating costs next to them. At first, the Explorer can feel overwhelming. But trust me: once you start digging, it is hard to stop. And in the end?
GTFS data is complex because public transport networks are complex. On a map, they become something you can almost touch.
Why we built it: open data doesn’t mean readable data
In recent years, GTFS data has become widely available, and it is used more and more to plan and improve public transport networks. Germany now publishes one feed for the whole country, updated weekly. In Baden-Württemberg, it can show which towns already have the bus or train every 15 or 30 minutes that the state’s Mobilitätsgarantie promises. In Hamburg, it can show which stops already see a vehicle every five minutes, as the Hamburg-Takt aims for by 2030.
But spotting that in a folder of text files is hard. That is where the Explorer started: with customers who asked us for a way to run accessibility analysis together with their transit networks. They needed two things: to see operational statistics for the existing network (service, costs, geometry), and to edit the network to test changes. We released viewing first, in GOAT 3.1 “Alpine”, and we are now building editing. For editing, we chose to support only operational planning: service, costs and geometry will update live as you edit, and accessibility analysis will run on the edited network a few seconds after you save.
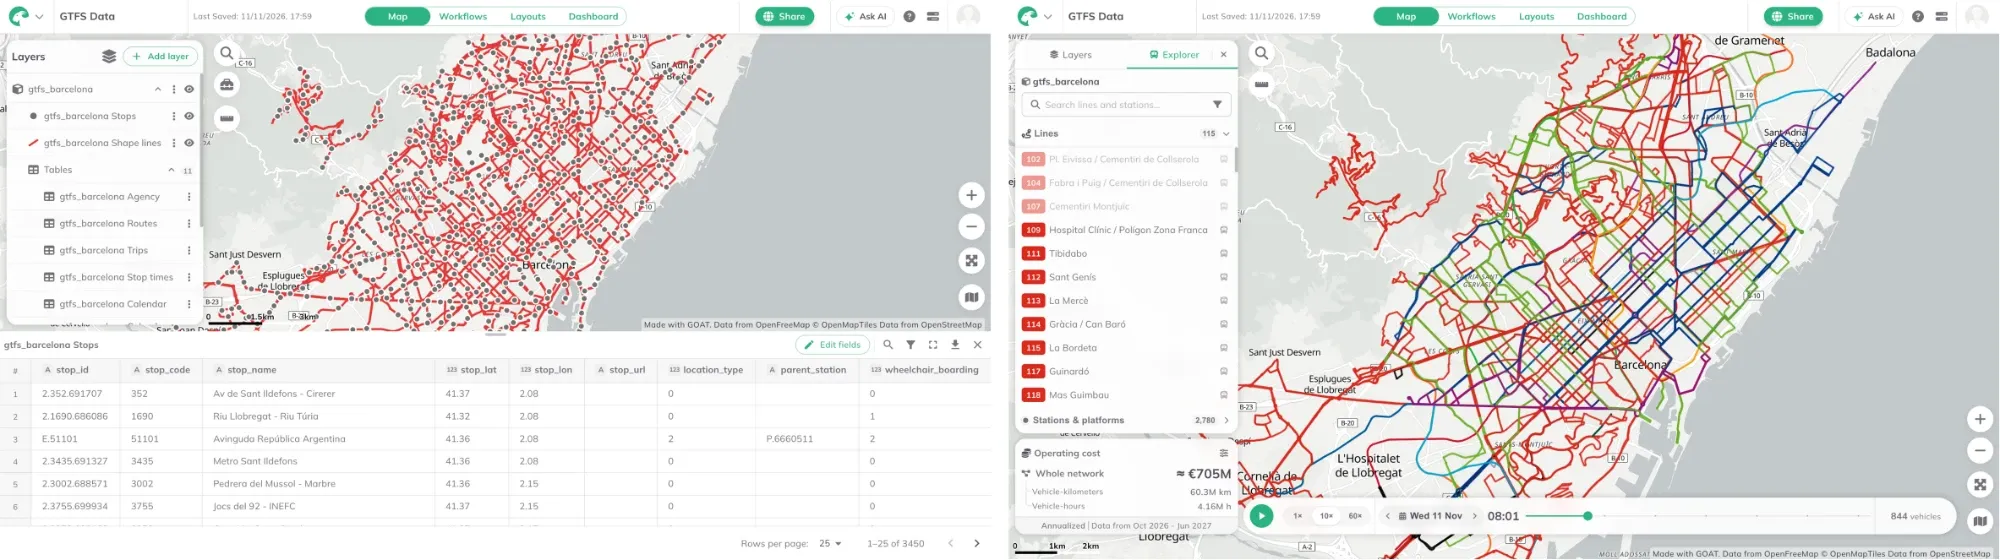
Before and after: Barcelona’s feed as layers and tables, and the same feed in the Explorer.
Before we started building the Explorer, we studied how competitors handle similar features in their PT planning software. From a large mobility software company’s web tool, where service planners redesign lines and timetables and see the effect straight away, to a collaborative platform that covers everything from route design to scheduling and on-demand services, the tools we studied vary a lot. One is built around accessibility, letting you compare how many jobs or destinations people can reach under different transit scenarios. Another is a free, browser-based editor for drawing routes, building timetables and publishing a valid GTFS feed.
The market research made the scope clear: we wanted to build the Explorer for network-level planning, which fits GOAT’s focus on accessibility analysis. It leaves out ground-level operations planning and dispatch, extra datasets such as ridership, and rider-side planning such as fares and transfers inside stations.
How we built it: from a folder of files to a network on the map
The Explorer builds on GOAT’s PT network bundle. When you import a GTFS feed, GOAT stores it as a bundle: a group of layers (stops, routes, trips, stop times) that belong together. Those layers are a simplified view of the feed, so the Explorer reads the whole feed at once and shows it the way riders and planners think about it. You open it from the bundle’s More Options menu. GOAT then draws the network itself, every line in its own colour, and hides the bundle’s own layers until you leave the Explorer.
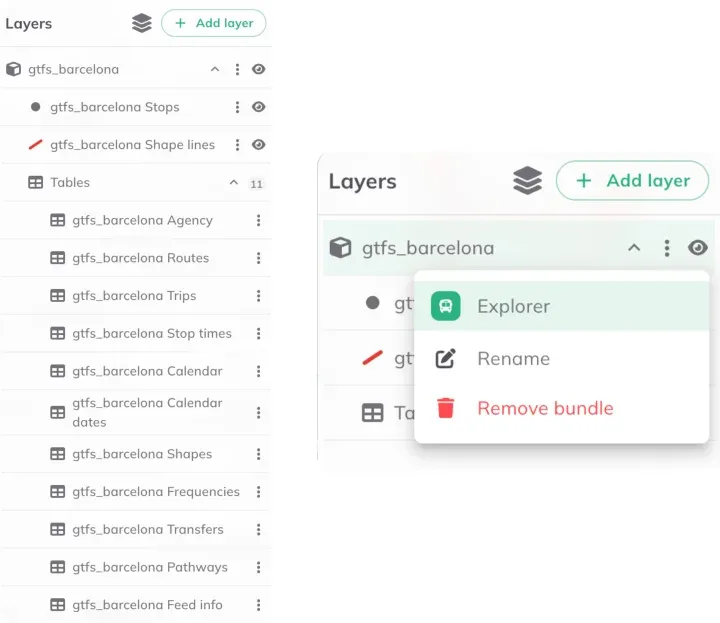
A GTFS bundle in the Layers panel, and the menu that opens it in the Explorer.
The Explorer’s user interface loosely follows GTFS data structuring principles, retaining the schema’s data hierarchy. This means user navigation tends to flow from the largest to the smallest entity (from the whole network to a line, then one of its trips, then the stops that trip calls at), along with metrics such as operating costs updating as you explore. On launch, the Explorer displays a network-level overview of lines and stops, operating costs and a visualisation of the network on the map. Lines and stations can be searched and filtered by transport mode and agency.
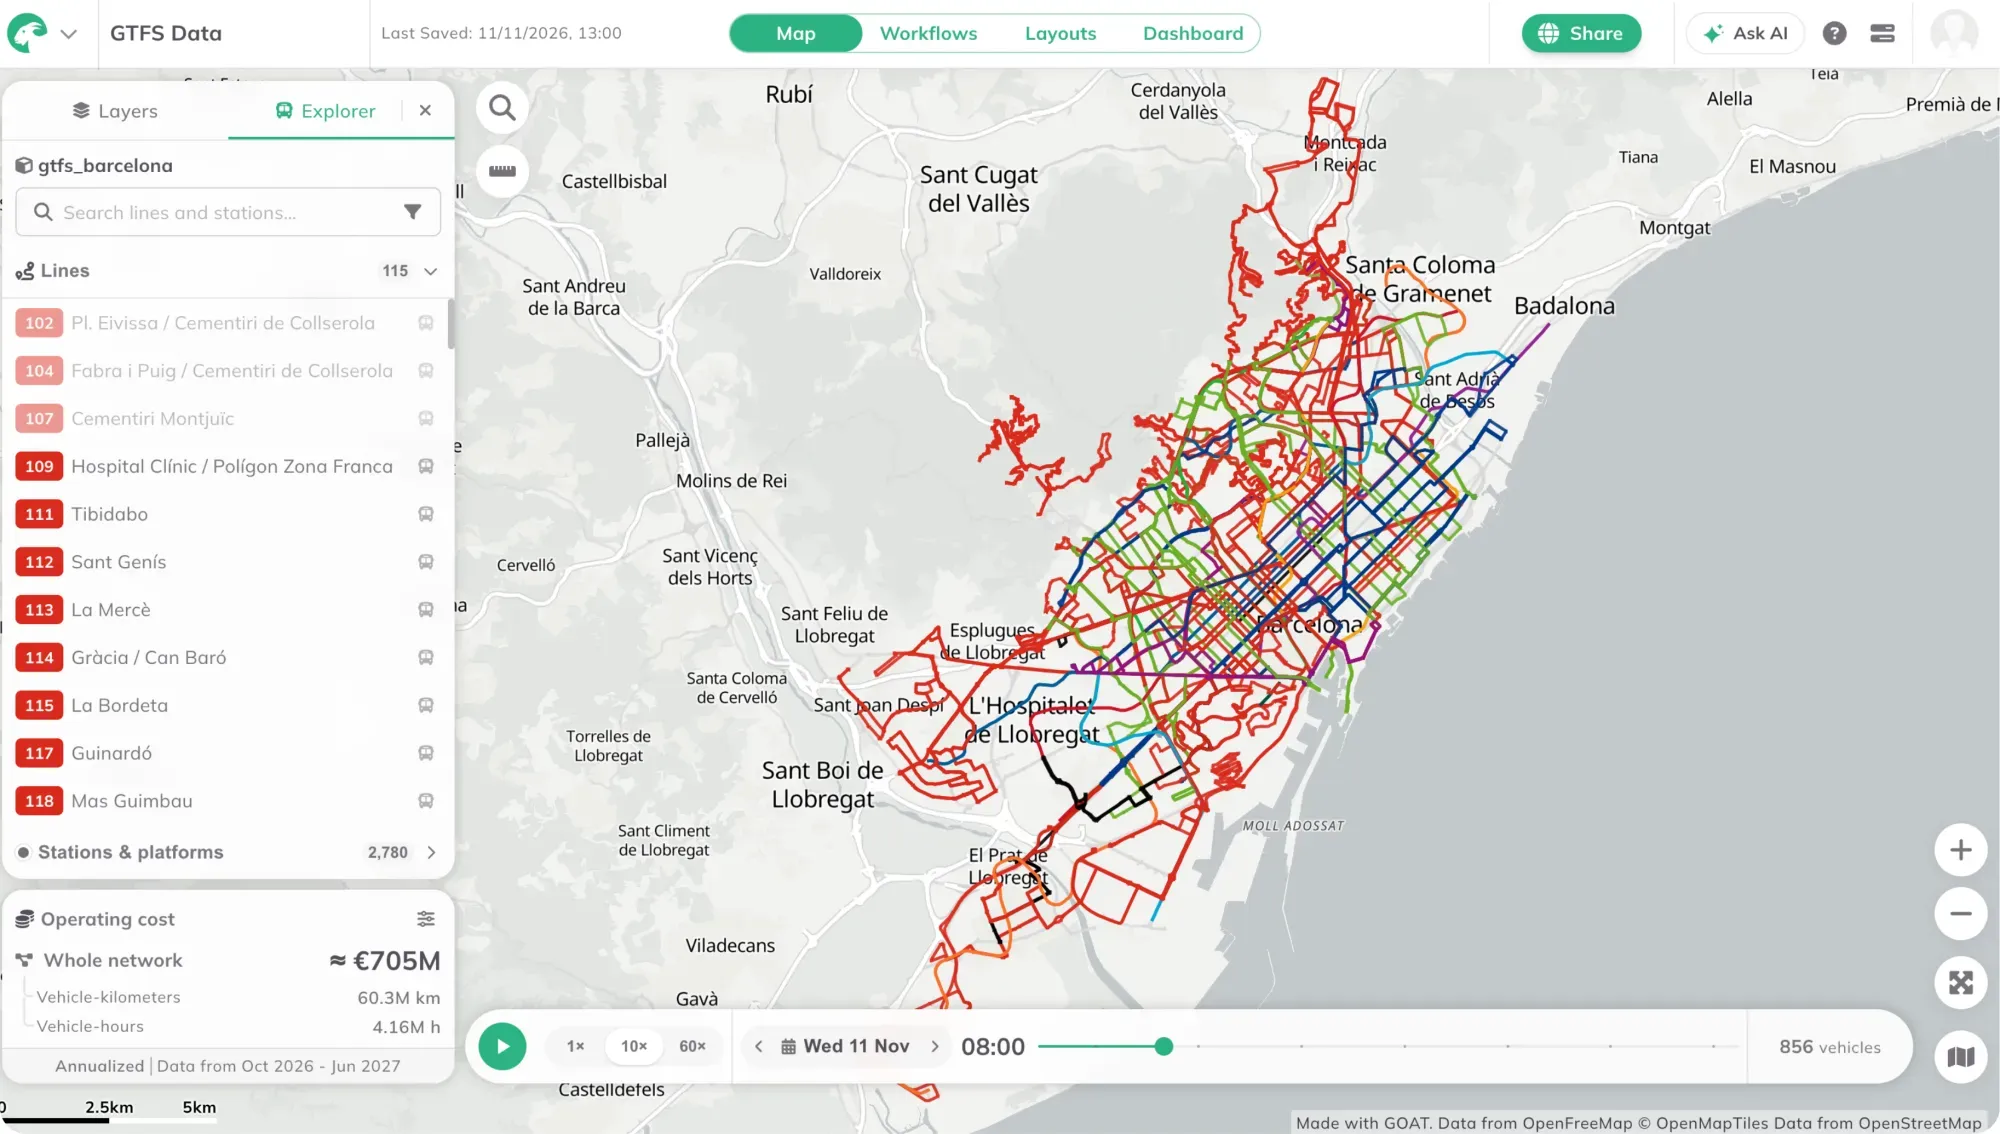
Network overview for Barcelona: lines, stops and operating costs on opening.
Each level shows what a planner would look for:
- Lines: how often the line runs in each time period, how many of its vehicles are out through the day, the end-to-end running time and the first and last departures. A Stops tab draws each direction as a line diagram with the minutes and distance between stops, including short turns and express variants.
- Stations: the timetable of each line and direction, the next departures, and wheelchair boarding where the feed records it.
- Trips: every stop with its time, with arrows to step to the trip before or after.
- Calendar: the feed’s period month by month, each day coloured by its day type, with the days where service is added or removed. Click a day and every figure in the Explorer switches to it.
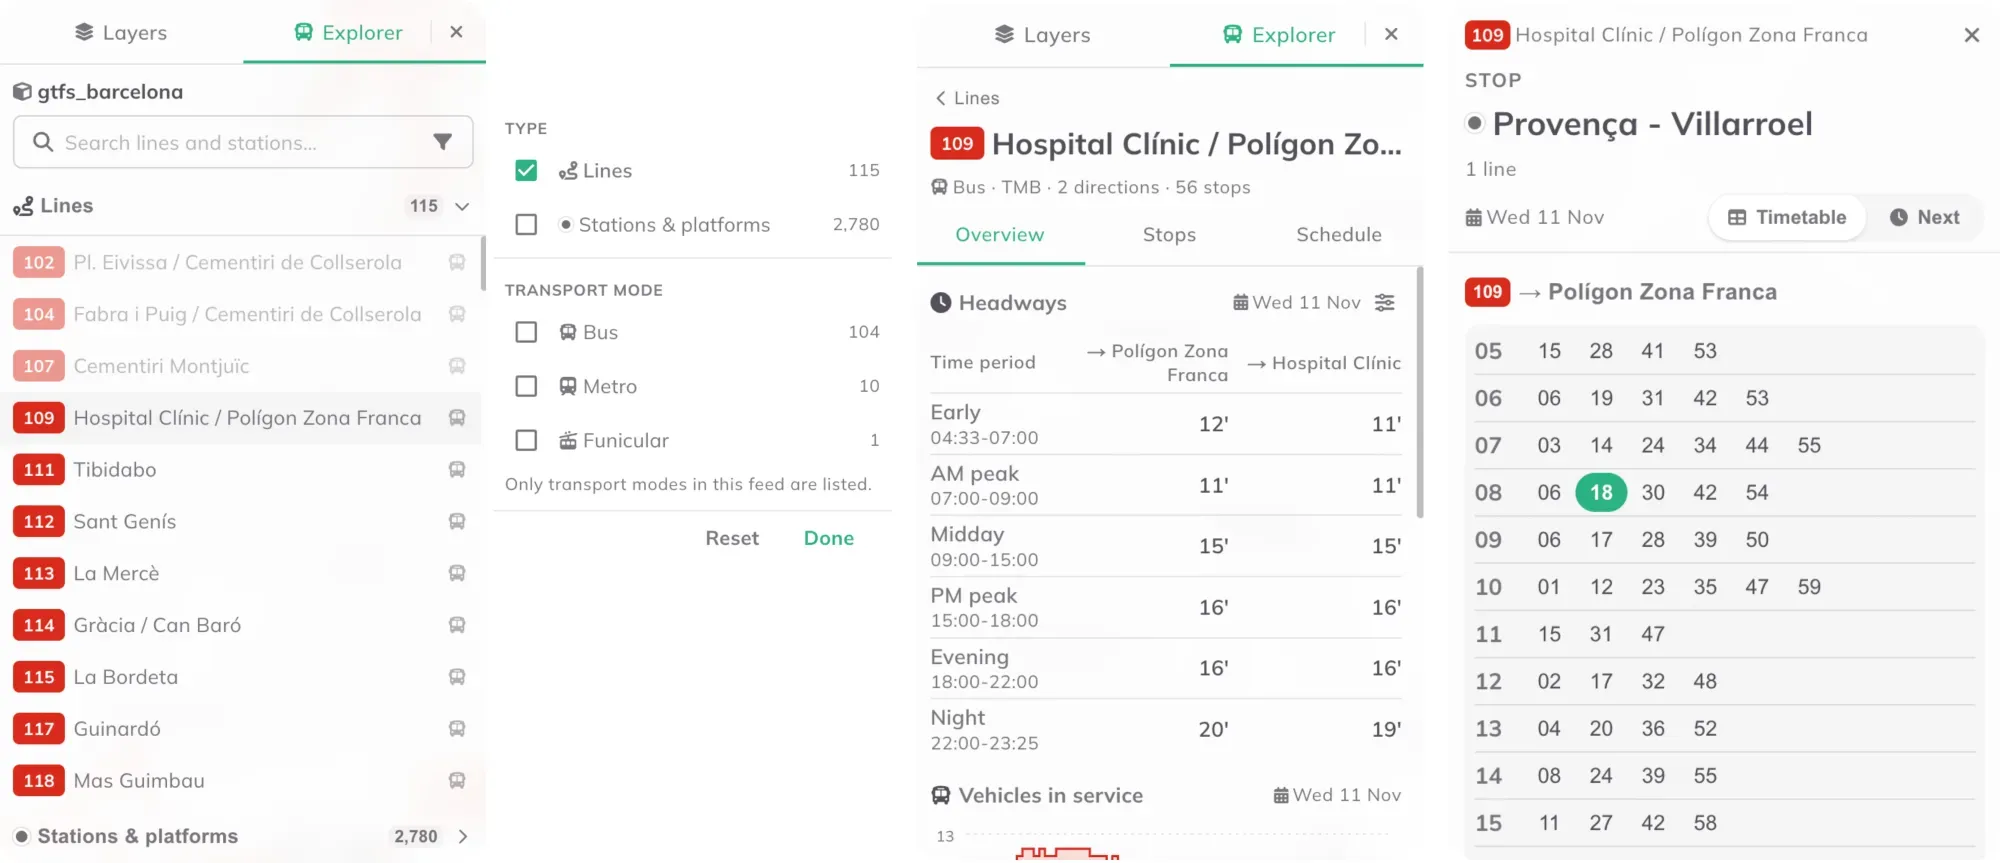
From left: the line list, the filters, a line’s headways and a stop’s timetable.
The operating cost card estimates what the network, one line or one trip costs to run in a year: vehicle-kilometres times a rate per kilometre, plus vehicle-hours times an optional rate per hour, both counted from the timetable and its calendar. Each kind of vehicle has a default rate (for example 5.5 € per km for buses and 24 € per trainset-km for metro and rail), and you can set your own per agency.
Barcelona’s network played through the day.
The bar at the bottom of the map holds the date and the clock. Every figure in the Explorer refers to that one date: headways, trip counts and stop departures are all computed from the feed’s own timetable for that day. Press Play and the network’s vehicles run through the day at 1×, 10× or 60× speed, so you can see dwell times and where connections between lines meet or miss. Select a line and the bar grows into a trip strip: a time-distance chart of all its trips, with the time of day across and the distance along the route down.
From a technical standpoint, PT network bundles hold all the data of the original GTFS feed converted to Parquet files. These are compressed and sent to your browser the first time you open the Explorer, so that first open can take a bit longer. After that, the network stays cached in your browser until it is edited. Either way, the files are read into a database that runs inside your browser (DuckDB). That is why the charts and figures in the Explorer appear as you click.
What made it hard: one timetable, many ways to write it
The most challenging aspect of building the Explorer was designing it in a way that allows users to understand and interact with the complex structure of dense public transport data. All while keeping the analytics and visualisations fast and on demand.
While testing on feeds from around the world, I realised that the same network planning and operation concepts can be represented in many different ways, and that the Explorer needs to handle all of them. One example is Barcelona, where some stops along a line have no scheduled departure time. The Explorer then uses the times of the stops before and after as a window, or interpolates between them. Other feeds use duplicate lines and branches with complex service patterns to describe holiday, school or seasonal service.
See how your network really runs
A GTFS feed used to be a set of tables. In the Explorer it becomes a network you can read: which lines run often and which do not, when service stops in the evening, on which days a line does not run, and roughly what it all costs to operate.
Take metro line L5 on an ordinary weekday in the current timetable. In the morning peak, a train leaves every two minutes. After 22:00, it is one every seven. For a commuter, a missed train costs almost nothing. For someone heading home after a late shift, it can mean seven minutes on the platform. The Explorer shows that difference for every line in the feed, hour by hour.
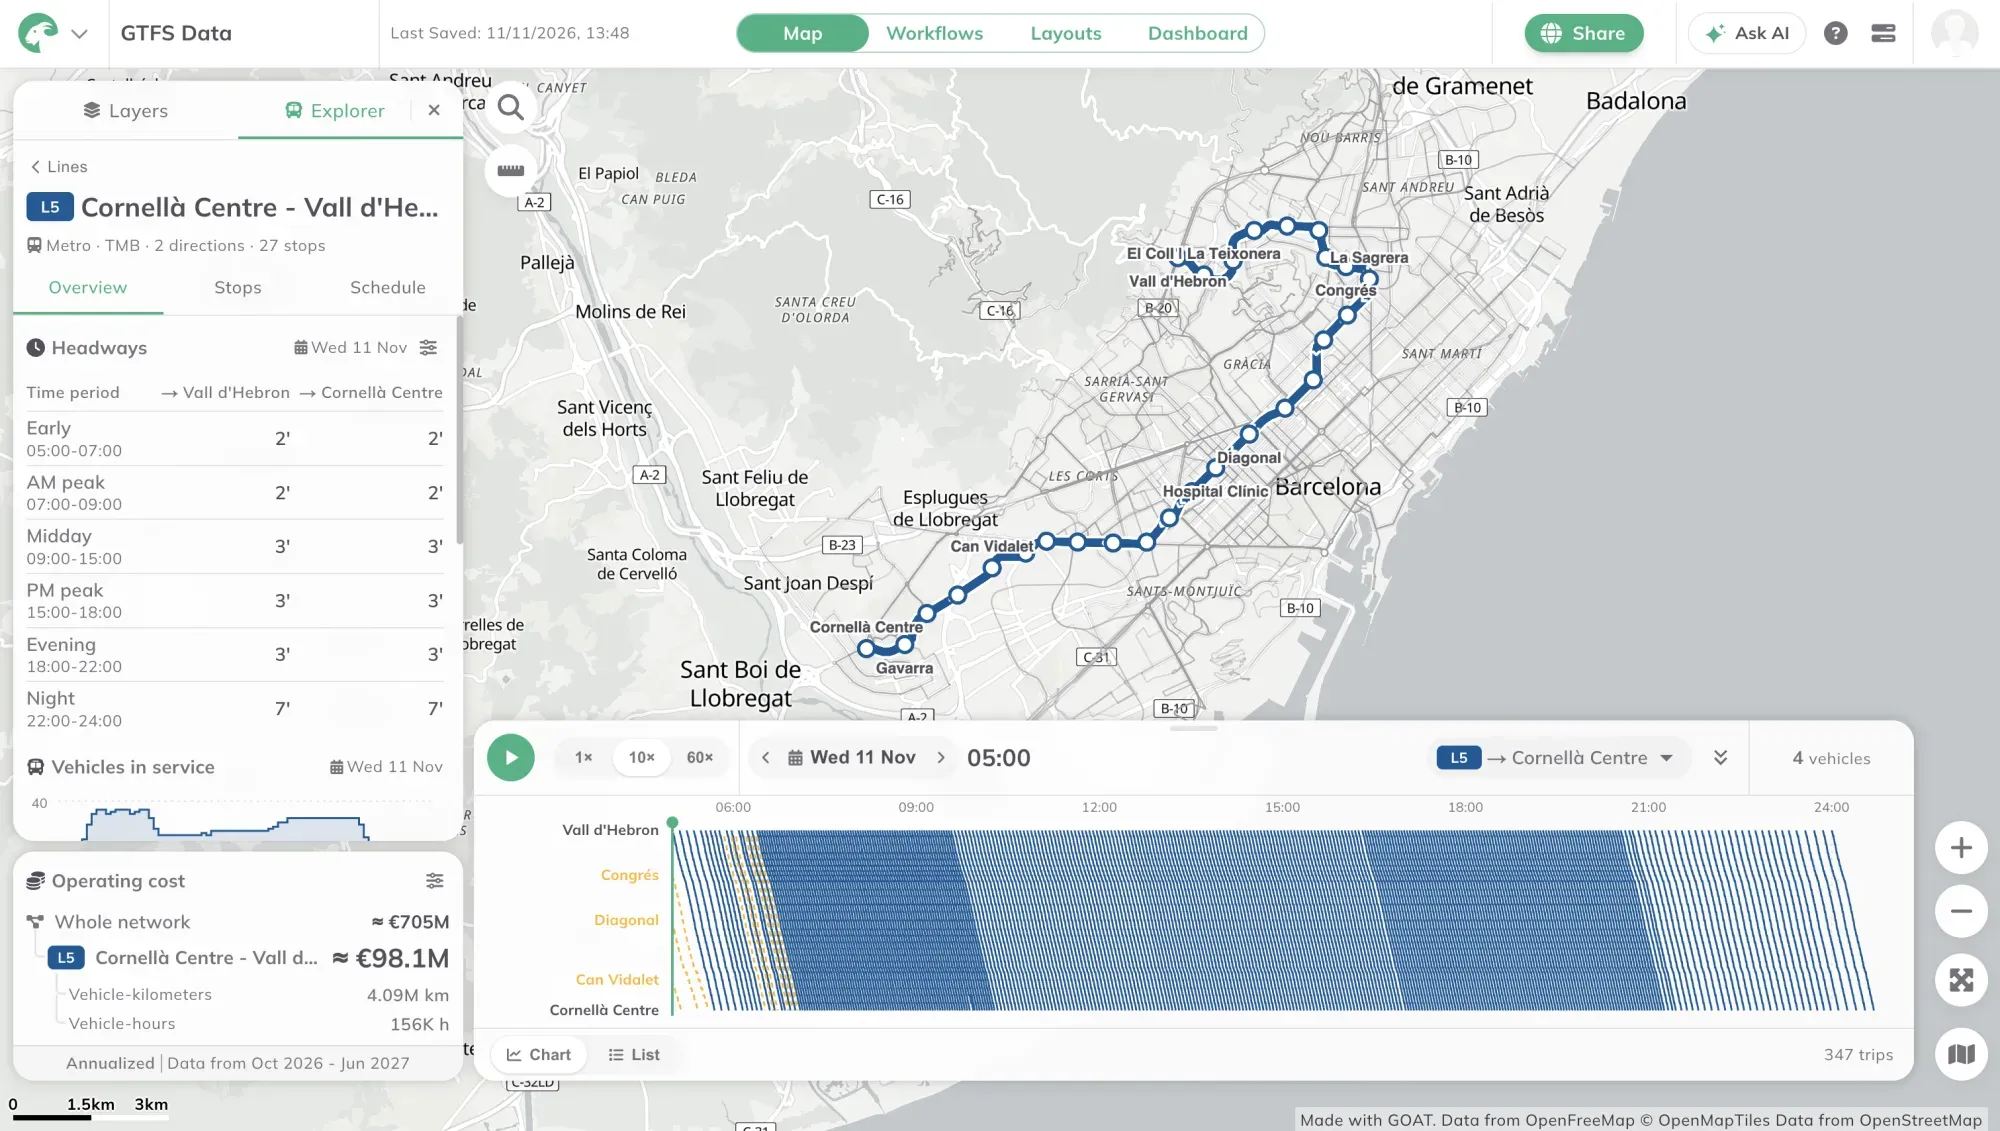
Metro line L5 in the Explorer. In the chart below the map, each line is one train: late in the evening the lines spread apart as trains run less often.
Next comes editing: change the network and see straight away what it does to service, costs and accessibility.
The PT Network Explorer is live now in GOAT 3.1. Bring your own GTFS feed, or start with one of ours: in Add layer, go to Connect data, choose Public transport network, pick a European city and press Add. Then open it in the Explorer and see what the network does on any day of the year.
Frequently asked questions
What is a GTFS feed?
GTFS (General Transit Feed Specification) is an open format that transit agencies use to publish their stops, routes, trips and timetables as a set of text tables.
Can I open my own city's GTFS feed in the PT Network Explorer?
Yes. Import your feed as a public transport network, or add a ready-made feed for a European city under Add layer, Connect data, Public transport network. Then open the bundle's menu in the Layers panel and choose Explorer. GOAT prepares the feed the first time, which can take a minute.
Can I edit a transit network in GOAT yet?
Not yet. The PT Network Explorer currently shows the network. Editing, with live service and cost figures and accessibility analysis on the edited network, comes in a later release.
How does GOAT estimate the operating cost of a transit network?
It counts vehicle-kilometres and vehicle-hours from the timetable and prices them at European average rates. The rates can be adjusted per agency and vehicle type.
Why does the PT Network Explorer take longer to open the first time?
On first open, GOAT sends a compressed copy of the feed to your browser. After that the copy is cached, so the Explorer opens faster until the network changes.
Do I need GIS skills to use the PT Network Explorer?
No. You move from the whole network to a line, a trip or a stop, and GOAT computes every figure for you.